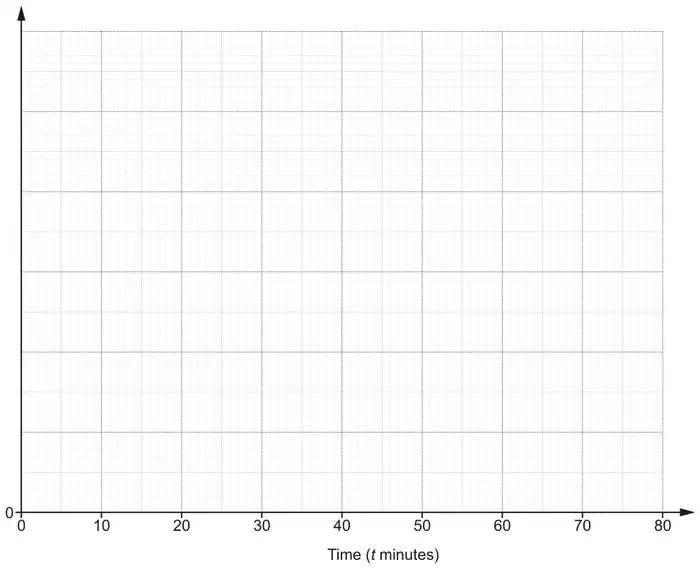
19 Ceri records the time taken, \(t\) minutes, to travel to school for a sample of 168 students at her Academy.
Time taken (\(t\) minutes)
Frequency
\(0 \lt t \leqslant 10\)
54
\(10 \lt t \leqslant 20\)
50
\(20 \lt t \leqslant 40\)
44
\(40 \lt t \leqslant 80\)
20
(a) Draw a histogram to represent this information.[4]
(b) Ceri says
The longest time that any of these students took to travel to school was 80 minutes.
Is she correct? Give a reason for your answer. [1]
(c) Ceri also claims that 25% of all of the students at this Academy took more than 30 minutes to travel to school.
(i) Show how Ceri might have worked out her claim. [2]
(ii) State one assumption that Ceri has made in making her claim. [1]
Mark scheme (a)
Answer
Marks
Part marks and guidance
Correct histogram with blocks of height 5.4, 5, 2.2 and 0.5
3
B2 for 3 correct blocks or B1 for 2 correct blocks of different widths
½ small square accuracy for heights, no gaps between blocks Condone good freehand if in tolerance Condone omission of vertical line at \(t\) = 80 Other correct histograms may be possible with different scales
If 0 scored, SC1 for 3 correct freq densities soi 5.4 oe, 5 , 2.2 oe and 0.5 oe
For SC1 oe accept e.g. \(\dfrac{44}{20}\) isw for 2.2
Vertical axis labelled ‘frequency density’ and a correct linear scale shown
1
At least 2 numbers shown for linear scale (other than zero), A correct linear scale could use e.g. 2 cm to 1 unit or 2 cm for 2 units Accept FD for frequency density label
Mark scheme (b)
Answer
Marks
Part marks and guidance
We don’t know oe and correct reason
1
e.g. Not sure, as exact data not given.
Accept No with correct reason but do not accept ‘yes’ with any reason e.g. No, all we know is that the longest time is in the group from 40 to 80 See AG
Appendix: exemplar responses for Q19b
Response
Mark
No all we know is that it lies between 40 and 80
1
They may have taken 80 minutes but we don’t know that for sure – they may have all been less than 60
1
No [because the time section says \(40 \lt t \leqslant 80\),] they may have been less than 80
1
No there is a range of values for the time so not definitely 80
1
No as the time is given as a range
1
No we are not give the accurate values
1
It might be but we would need to know the exact values to find out
1
Yes 80 is the highest value
0
Yes with any comment
0
Mark scheme (c)
Answer
Marks
Part marks and guidance
(i) 20 + 44 ÷ 2 = 42
M1
or 168 – 54 – 50 – 44 ÷ 2
Accept 22 for 44 ÷ 2
42 is 25% of [total ]168 oe
A1
with no errors seen
Accept e.g. ¼ of 168 = 42, 168 ÷ 4 = 42 \(\dfrac{42}{168} = \dfrac{1}{4}\) etc oe
These two steps may be done in reverse order
(ii) Correct statement on assumption made
B1
e.g. Sample is representative oe Distribution of students in the school is the same as the sample Data is distributed uniformly across the times/ the interval \(20 \lt t \leqslant 40\) oe Half of the students in \(20 \lt t \leqslant 40\) took longer than 30 minutes 22 of the students took between 30 and 40