
Higher November 2018 Paper 4 Q12
12 30 students completed a puzzle and their times were recorded.
All of the students completed the puzzle in less than 50 seconds.
The histogram shows information about some of their times.
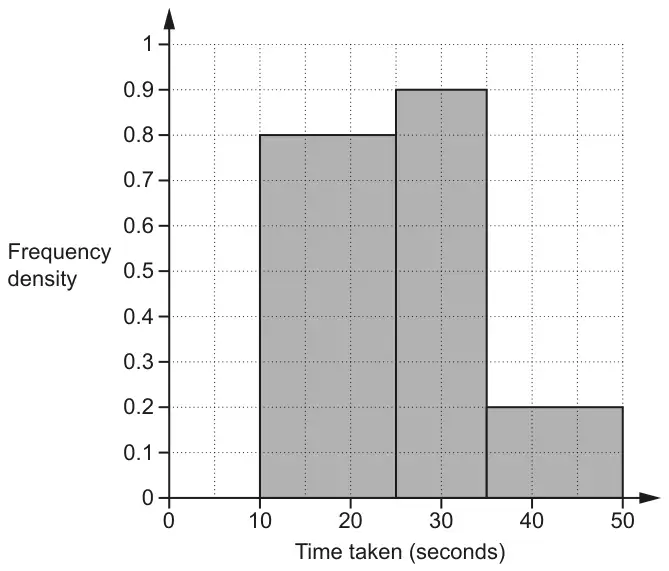
Complete the histogram for those completing the puzzle in less than 10 seconds. [5]
| Answer | Marks | Part marks and guidance | |
|---|---|---|---|
| correct bar width and ‘height’ of 0.6 | 5 | M2 for 15 × 0.8 + 10 × 0.9 + 15 × 0.2 or better e.g. 12 + 9 + 3 or 24 or M1 for two correct frequencies calculated from 12, 9 and 3 AND M1 for 30 – their 24 soi 6 M1 for their 6 ÷ 10 soi 0.6 | |