
Higher November 2024 Paper 3 Q18
18 The table shows information about the height of 40 plants.
| Height, \(h\) cm | Frequency | Class width | |
|---|---|---|---|
| \(0 \leqslant h \lt 5\) | 6 | ||
| \(5 \leqslant h \lt 15\) | 15 | ||
| \(15 \leqslant h \lt 25\) | 9 | ||
| \(25 \leqslant h \lt 50\) | 10 |
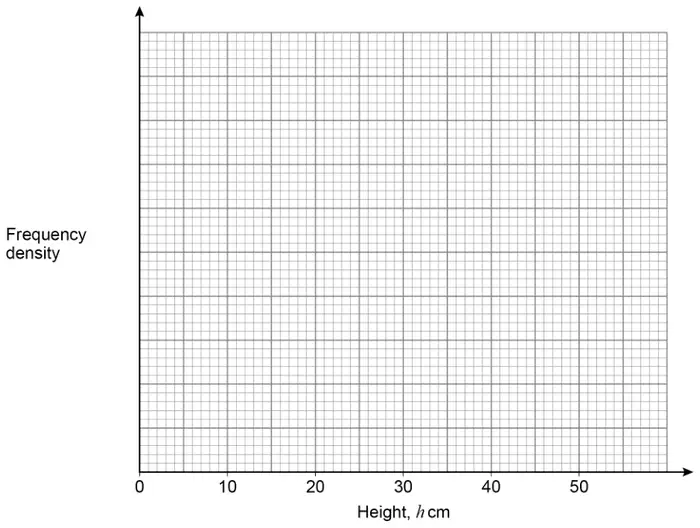
Draw a histogram to represent the heights. [4 marks]
| Answer | Mark | Comments |
|---|---|---|
| \(6 \div 5\) or 1.2 or \(15 \div 10\) or 1.5 or \(9 \div 10\) or 0.9 or \(10 \div 25\) or 0.4 | M1 | one correct frequency density implied by a correct bar |
| At least 3 of 1.2 and 1.5 and 0.9 and 0.4 | M1dep | |
| At least 3 correct bars with correct linear scale on the vertical axis | M1dep | dep on M2 |
| Fully correct histogram with linear scale on the vertical axis | A1 |