
Higher November 2023 Paper 3 Q13
13 100 people were asked about the distance they travel from home to work.
The table shows information about the results.
| Distance, \(d\) (miles) | Frequency |
|---|---|
| \(0 \leqslant d \lt 5\) | 21 |
| \(5 \leqslant d \lt 10\) | 24 |
| \(10 \leqslant d \lt 20\) | 37 |
| \(20 \leqslant d \lt 40\) | 18 |
(a) Write down the greatest possible number of people who work from home. [1 mark]
(b) One person is chosen at random.
Work out the probability that the person travels at least 10 miles. [1 mark]
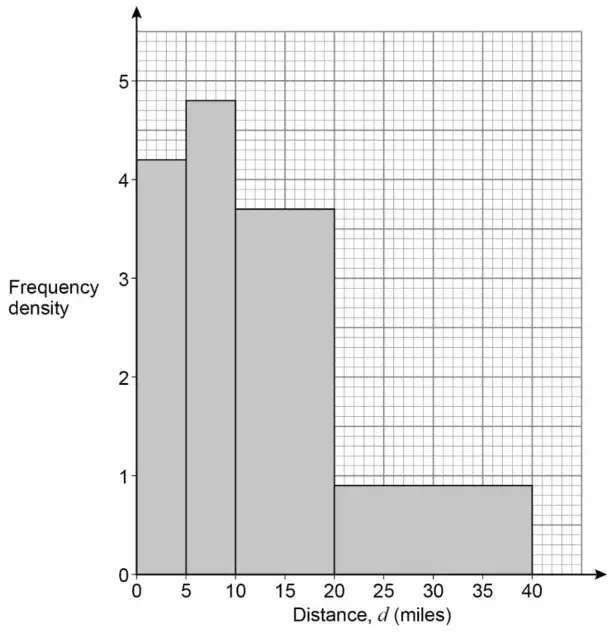
(c) Draw a histogram to represent the results. [3 marks]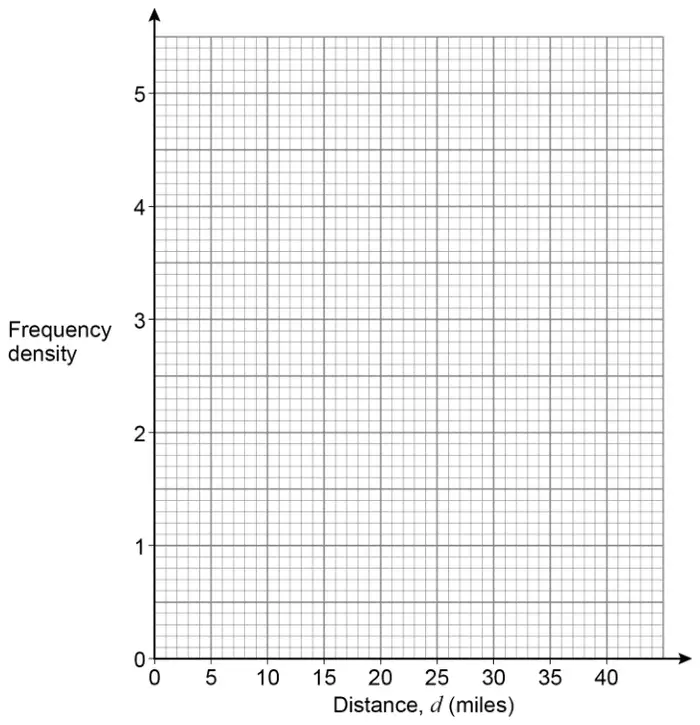
| Answer | Mark | Comments |
|---|---|---|
| 21 | B1 |
| Answer | Mark | Comments |
|---|---|---|
| \(\dfrac{55}{100}\) or \(\dfrac{11}{20}\) or 0.55 or 55% | B1 | oe fraction, decimal or percentage |
Additional guidance
Ignore incorrect simplification or conversion after correct answer seen
| Answer | Mark | Comments |
|---|---|---|
| \(21 \div 5\) or 4.2 or \(24 \div 5\) or 4.8 or \(37 \div 10\) or 3.7 or \(18 \div 20\) or 0.9 | M1 | implied by a correct bar |
| At least three of 4.2 4.8 3.7 0.9 | M1dep | implied by at least three correct bars |
| Fully correct histogram | A1 | \(\pm\dfrac{1}{2}\) small square ignore frequency polygon if included |
Additional guidance
| Allow up to M2 even if not subsequently used or incorrectly plotted | |
| Allow up to M2 for correct heights seen on a frequency polygon | |
| Correct bars must have correct widths | |
 | M1M1A1 |