
Higher June 2023 Paper 3 Q15
15 180 runners started a marathon.
Some of the runners did not complete it.
(a) The histogram represents the times of the runners who did complete the marathon.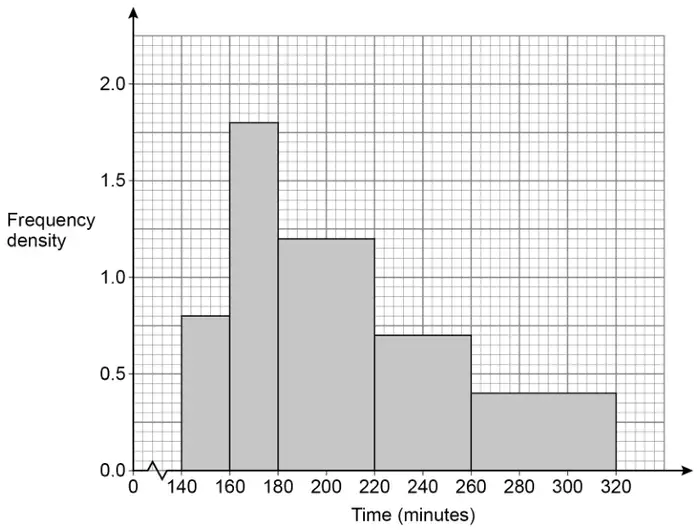
How many runners did not complete the marathon? [3 marks]
(b) The table shows information about the runners who did not complete the marathon.
| Distance run (miles) | |
|---|---|
| Least distance | 5 |
| Greatest distance | 23 |
| Lower quartile | 11 |
| Median | 18 |
| Interquartile range | 9 |
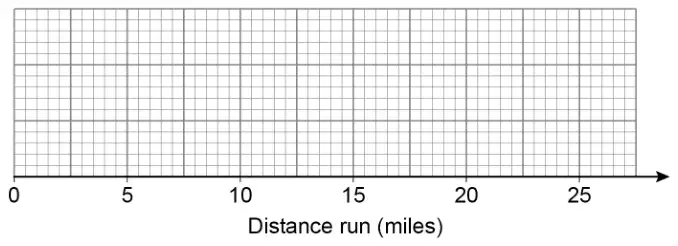
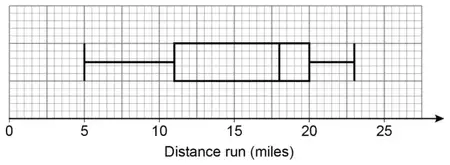
Draw a box plot to represent the information. [3 marks]
| Answer | Mark | Comments |
|---|---|---|
| \(20 \times 0.8\) or 16 or \(20 \times 1.8\) or 36 or \(40 \times 1.2\) or 48 or \(40 \times 0.7\) or 28 or \(60 \times 0.4\) or 24 | M1 | one correct area calculation or frequency value may be on diagram |
| \(20 \times 0.8 + 20 \times 1.8 + 40 \times 1.2 + 40 \times 0.7 + 60 \times 0.4\) or \(16 + 36 + 48 + 28 + 24\) or 152 | M1dep | allow 1 error or 1 omission or 1 misread of a frequency density value |
| 28 | A1 |
| Answer | Mark | Comments |
|---|---|---|
| Rectangular box plot with whiskers to 5 and 23 | B1 | |
| Lower quartile drawn at 11 and median drawn at 18 | B1 | |
| Upper quartile drawn at 20 | B1ft | correct or ft their lower quartile \(+\ 9\) must be the vertical line at right side of their box |
Additional guidance
| Mark intention eg any height and allow horizontal line through centre of box | |
| Allow ends of whiskers to be vertical lines of any length, dots, crosses or stops | |
| \(\pm\dfrac{1}{2}\) small square tolerance | |
| Median must be the second vertical line of a box with three vertical lines | |
| Only vertical lines or points plotted | B0 |
 | B3 |