
Higher November 2022 Paper 2 Q18
18 A basketball team plays 19 home games and 19 away games.
The box plot shows information about the points the team scored in home games.
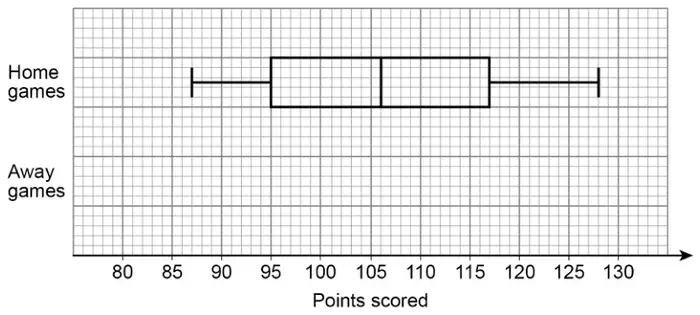
Here are the points the team scored in the 19 away games.
85 89 93 95 96 96 98 98 98 99
100 103 105 107 109 110 114 119 126
(a) On the grid, draw a box plot for the away games. [4 marks]
(b) On average, did the team score more points in home games or away games?
Use one statistical measure to support your decision. [1 mark]
(c) Was the number of points scored more consistent in home games or away games?
Use one statistical measure to support your decision. [1 mark]
| Answer | Mark | Comments |
|---|---|---|
| Median = 99 | B1 | implied by correct line on box plot |
| Lower quartile = 96 | B1 | implied by correct start of box |
| Upper quartile = 109 | B1 | implied by correct end of box |
| Fully correct box plot | B1ft | ft their stated median, LQ and UQ whiskers must be correct |
Additional guidance
First 3 marks can be awarded even if a box plot is not drawn
| Answer | Mark | Comments |
|---|---|---|
| Home and valid reason referring to median | B1ft | eg Home and median is higher (in home games) ft their box plot or their values |
Additional guidance
| Strict ft | |
| Values for the medians do not need to be stated, but if stated they must be 106 and correct for their box plot | |
| Use of any other measure along with correct response is B0 eg Home as median is higher and so is the biggest value | B0 |
| 106 is bigger than 99 so Home | B1 |
| Home matches as the average was 7 more | B1 |
| Median home 106 Median away is 99 So Home | B1 |
| Median home 106 Median away is 99 | B0 |
| Home as my box plot shows it | B0 |
| Home. The mean is 7 more | B0 |
| Home as the average is higher | B0 |
| They generally do better in home matches so Home | B0 |
| Answer | Mark | Comments |
|---|---|---|
| Away and valid reason referring to interquartile range | B1ft | eg Away and interquartile range is lower (in away games) ft their box plot or their values |
Additional guidance
| Strict ft | |
| Values for the interquartile ranges do not need to be stated, but if stated they must be 22 and correct for their box plot | |
| Answer states that ranges are equal alongside a correct response | B1 |
| Answer based on range only | B0 |
| Use of any other measure (apart from range) along with correct response is B0 eg Away as IQR is lower and the upper quartile is also lower | B0 |
| 13 is lower than 22 so Away | B1 |
| Away matches as the spread was 9 less | B1 |
| Away matches as the spread was lower | B0 |
| Away because the box is narrower | B1 |
| IQR home 22 IQR away is 13 So Away | B1 |
| IQR home 22 IQR away is 13 | B0 |
| Away as my box plot shows it | B0 |
| Away. The LQ is bigger | B0 |
| Away as the average is lower | B0 |
| They generally do worse in away matches so Away | B0 |