
Higher June 2024 Paper 6 Q13
13 A group of students record the time taken to travel to school.
All students in the group took less than an hour to travel to school.
Some of their results are recorded on this histogram.
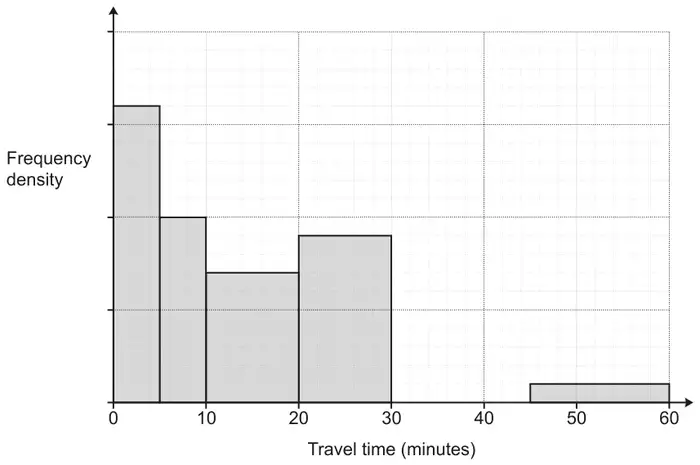
16 students took less than 5 minutes to travel to school.
(a) How many students took less than 20 minutes to travel to school? [4]
(b) 9 students took between 30 and 45 minutes to travel to school.
Add these students’ results to the histogram. [2]
| Answer | Marks | Part marks and guidance | |
|---|---|---|---|
| 40 nfww | 4 | B1 for freq density 3.2 for 0-5 bar soi M2 for 1.4 × 10 and 2 × 5 may be implied by 14 and 10 or M1 for 1.4 × 10 may be implied by 14 | Figures may be seen on bars Could be implied by correct fd used for bars 2 and 3 or from scale on diagram |
| OR For \(k \ne 1\) M3 for their \((16k + 10k + 14k) \div k\) or M2 for \(16k + 10k + 14k\) or M1 for two from \(16k\), \(10k\), \(14k\) | e.g M3 for (40 + 25 + 35) ÷ 2.5 or M2 for 40 + 25 + 35 or M1 two from 40, 25, 35 M3 for (80 + 50 + 70) ÷ 5 or M2 for 80 + 50 + 70 or M1 two from 80, 50, 70 | ||
| Answer | Marks | Part marks and guidance | |
|---|---|---|---|
| Bar for 30-45 drawn with height 3 small squares | 2 | M1 for 9 ÷ 15 soi by 0.6 | Condone good freehand |