
Higher November 2020 Paper 1 Q25
25 A histogram is drawn to represent the heights of a sample of women.
Three of the four bars are shown.
The bar for 170 cm \(\leqslant\) height \(<\) 180 cm is missing.
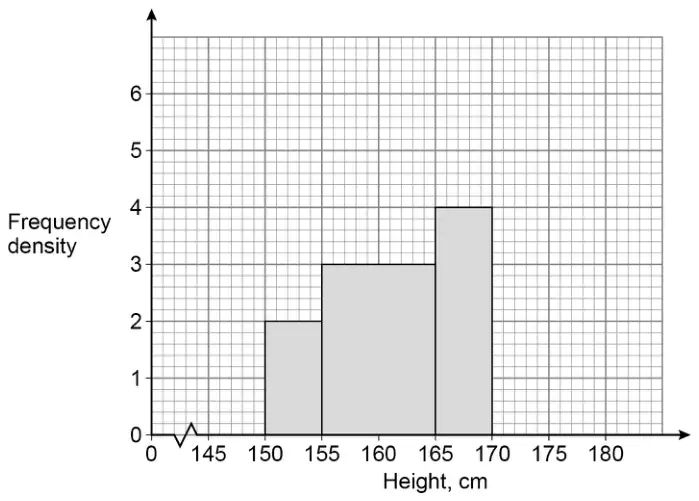
There are 74 women in the sample.
Complete the histogram. [4 marks]
| Answer | Mark | Comments |
|---|---|---|
| \(5 \times 2\) or 10 or \(10 \times 3\) or 30 or \(5 \times 4\) or 20 | M1 | oe may be written on bars |
| \(74 - 5 \times 2 - 10 \times 3 - 5 \times 4\) or \(74 - 10 - 30 - 20\) or 14 | M1dep | oe bar of area 14 implies M2 |
| their \(14 \div 10\) or 1.4 | M1dep | implied by correct bar for their 14 |
| Bar drawn from 170, width 10 and height 1.4 | A1 |
Additional guidance
| Bar from 170 to 175 with height 2.8 | M1M1M0A0 |