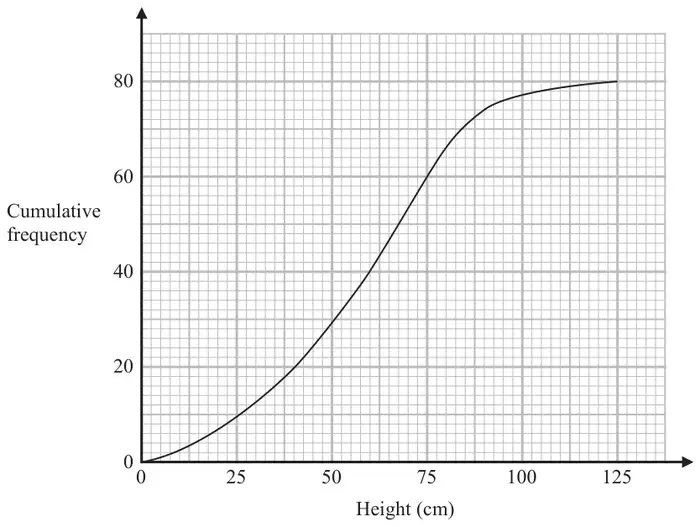
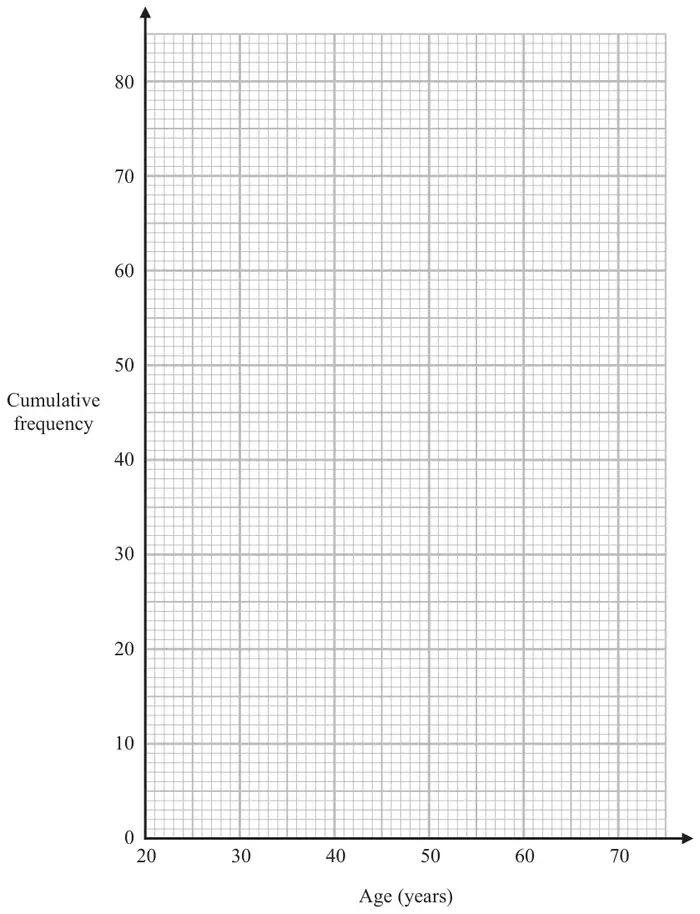
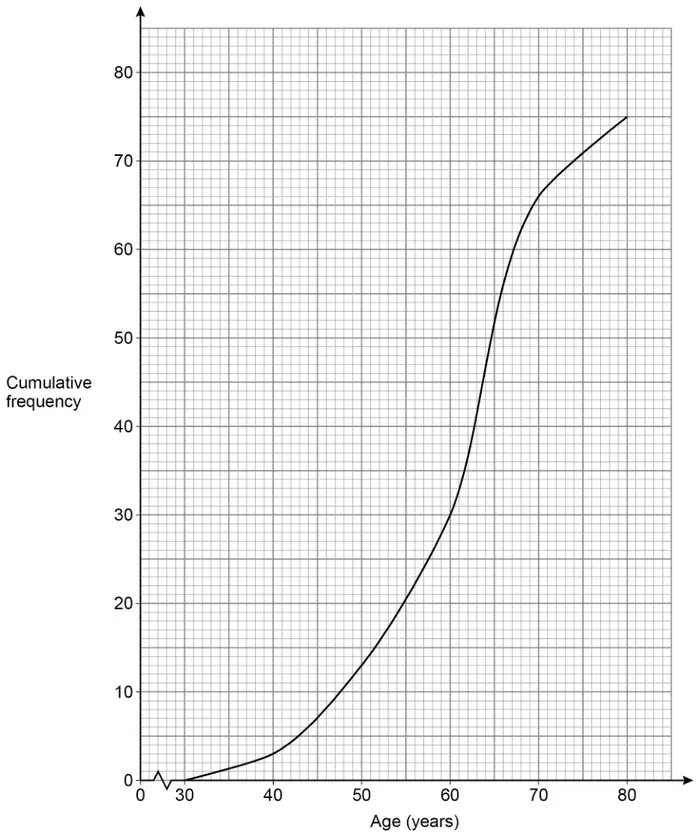
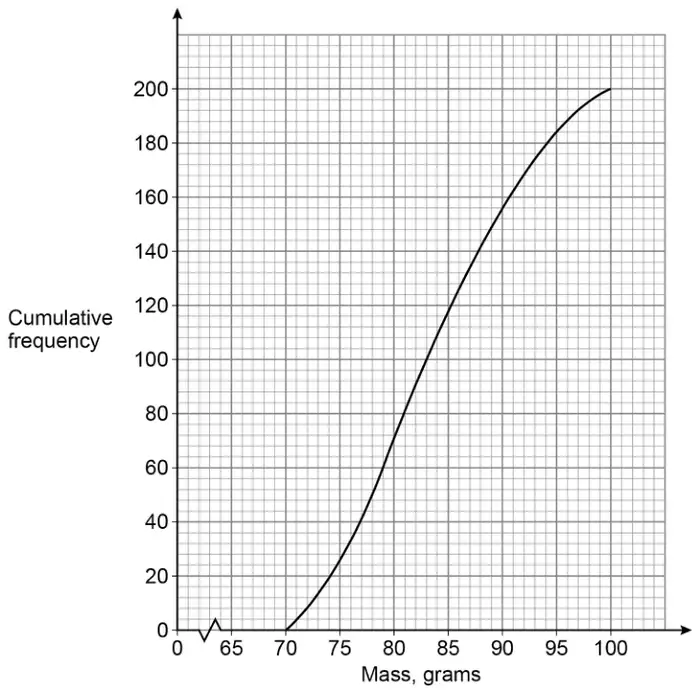
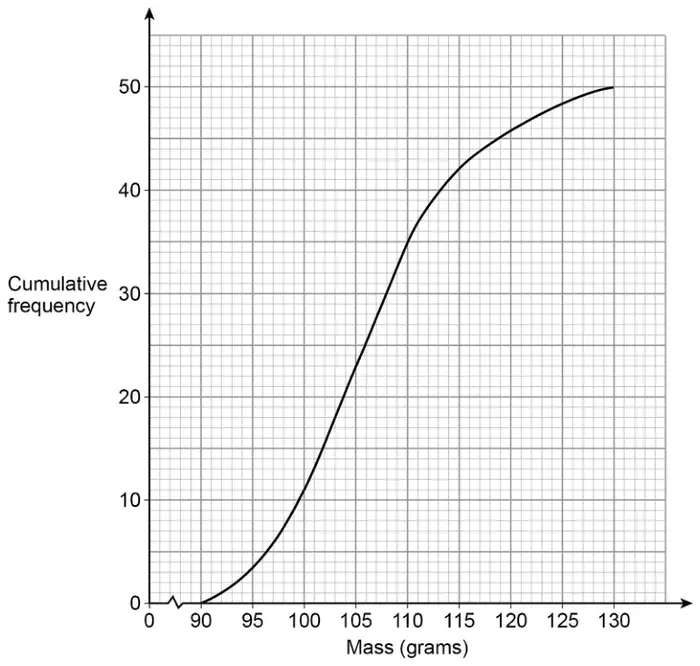
13 Alan grew 80 plants of the same type outside. The cumulative frequency graph shows information about the heights, in cm, of these plants.
One of the plants is chosen at random.
(a) Find an estimate for the probability that this plant will have a height greater than 90 cm. (2)
(b) Use the graph to find an estimate for the median height. (1)
(c) Use the graph to find an estimate for the interquartile range of the heights. (2)
Alan also grew plants of the same type inside. The interquartile range of the heights of these plants is 30 cm.
(d) Give one comparison between the distribution of the heights of the plants grown inside with the distribution of the heights of the plants grown outside. (1)
Mark scheme (a)
Answer
Mark
Mark scheme
\(\dfrac{6}{80}\)
M1
for correct method using the graph at 90 cm, eg \(80 - 74\ (= 6)\)
A1
for \(\dfrac{6}{80}\) oe, accept \(\dfrac{5}{80}\) oe
Additional guidance
Accept \(80 - 75\ (= 5)\)
Accept any equivalent fraction, decimal (0.075) or percentage (7.5%)
Mark scheme (b)
Answer
Mark
Mark scheme
60
B1
for answer in the range 58.5 – 61.5
Mark scheme (c)
Answer
Mark
Mark scheme
35
M1
for UQ = 75 or LQ = 40
A1
for answers in the range 34 to 36 or ft acceptable readings from the graph
Additional guidance
Allow UQ in range 74 to 76 Allow LQ in range 39 to 41 Value(s) may be seen on graph
Mark scheme (d)
Answer
Mark
Mark scheme
Comparison made
C1
(ft) for a correct comparison of the IQRs eg the heights of the plants grown outside are more varied or the IQR of the plants grown outside is 35 cm but the IQR of the plants grown inside is only 30 cm.
Additional guidance
The comparison must include some context (eg refers to heights or cm) Ignore any additional information provided there is no contradiction. Figures need not be seen but if given they must be correct.
for 4 or 5 points plotted correctly from the cumulative frequency table
A1
for a fully correct graph SCB1 if 4 or 5 points plotted not at end but consistent within each interval and joined by a curve or line segments providing no gradient is negative
Additional guidance
Ignore to the left of the first point and right of the last point If histograms drawn, points must be identified
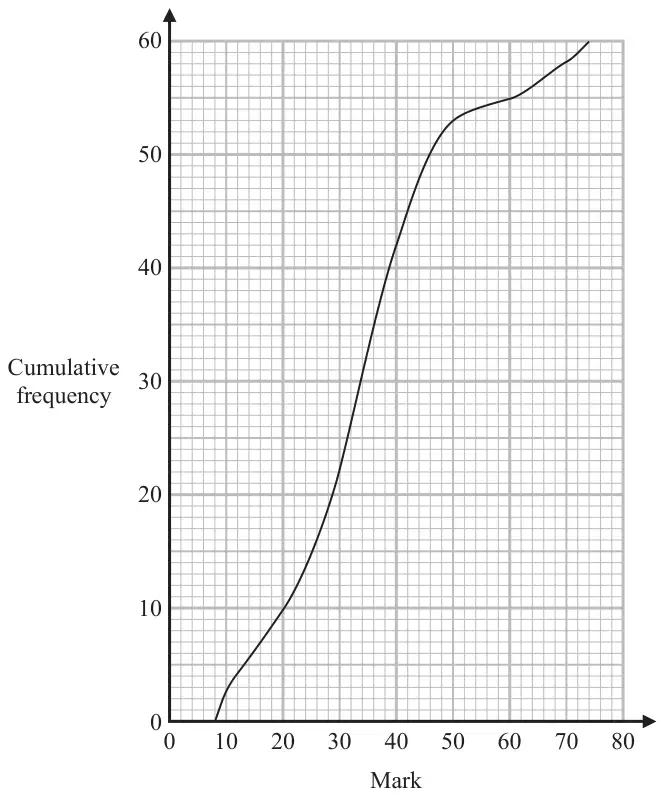
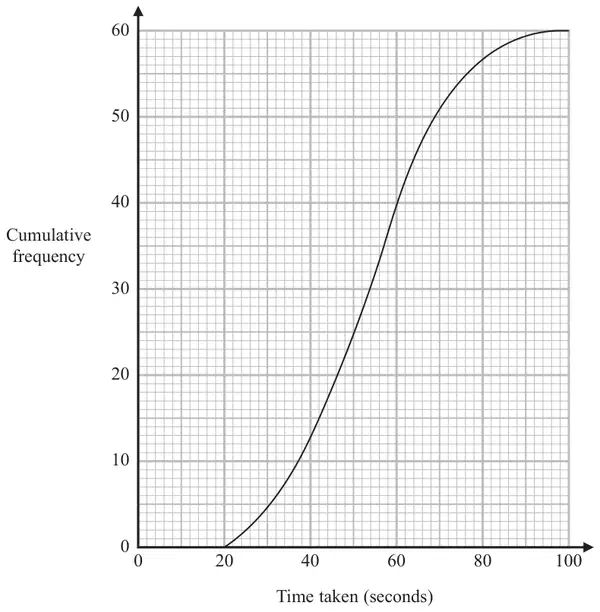
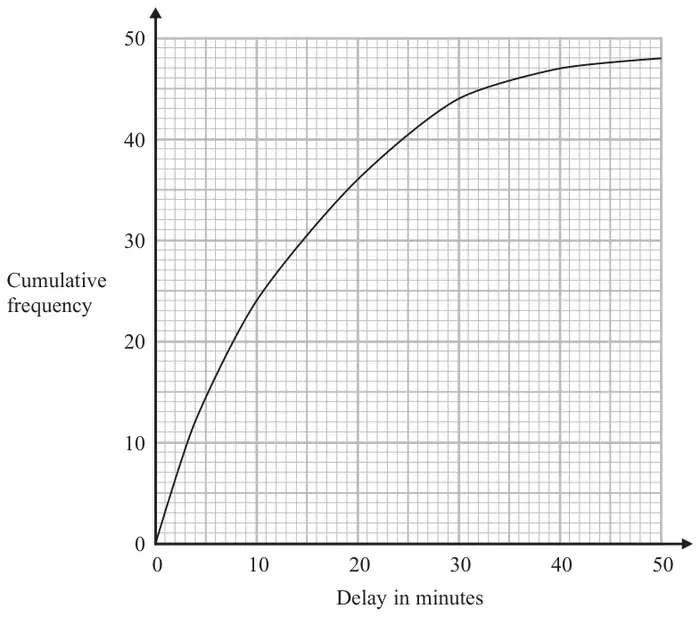
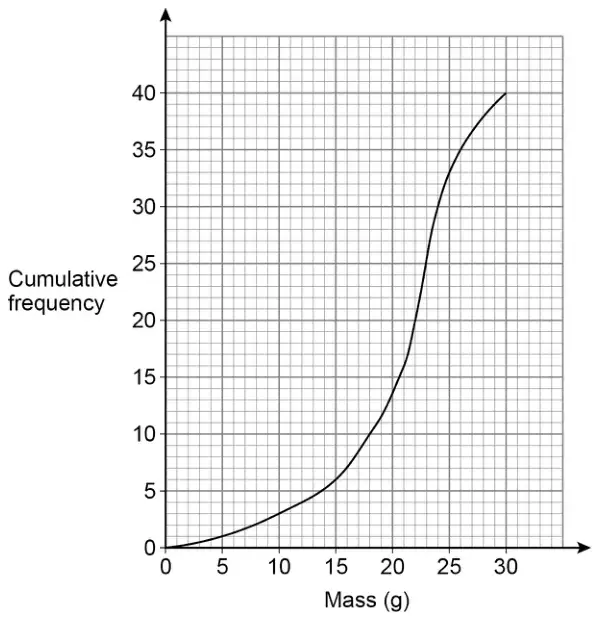
9 The times that 48 trains left a station on Monday were recorded.
The cumulative frequency graph gives information about the numbers of minutes the trains were delayed, correct to the nearest minute.
The shortest delay was 0 minutes. The longest delay was 42 minutes.
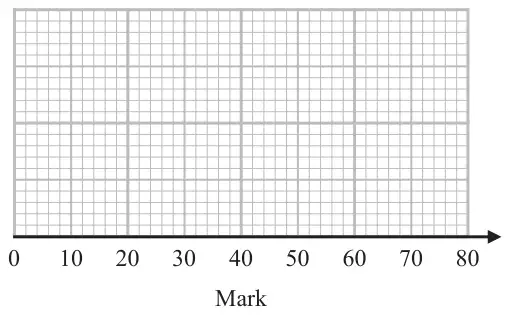
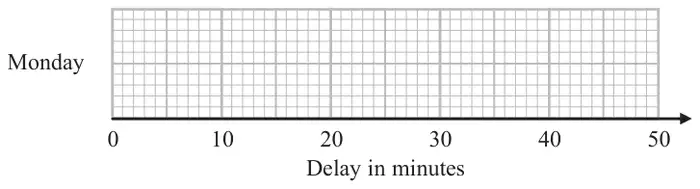
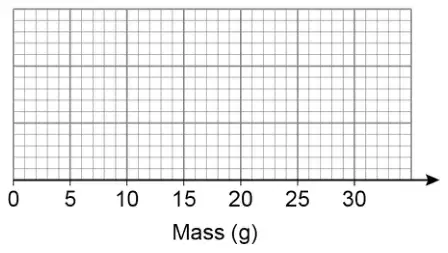
(a) On the grid below, draw a box plot for the information about the delays on Monday.(3)
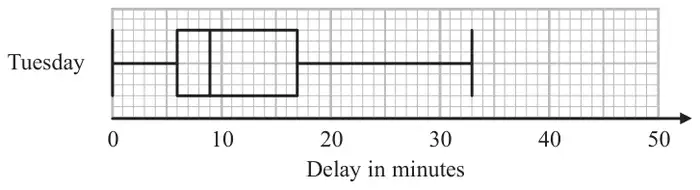
48 trains left the station on Tuesday. The box plot below gives information about the delays on Tuesday.
(b) Compare the distribution of the delays on Monday with the distribution of the delays on Tuesday. (2)
Mary says,
“The longest delay on Tuesday was 33 minutes. This means that there must be some delays of between 25 minutes and 30 minutes.”
(c) Is Mary right? You must give a reason for your answer. (1)
Mark scheme (a)
Answer
Mark
Mark scheme
box plot drawn
B1
ends of whiskers at 0 and 42 with a box
B1
median at 10 inside a box
B1
for ends of box at 4 and 20
Additional guidance
The box can be of any height. Accept ends that are marked (eg line, cross, dot) or defined by the end of the whiskers if clear.
Has to be inside a box; whiskers not required
An independent mark that can be awarded for just a box; do not need whiskers for this mark.
Mark scheme (b)
Answer
Mark
Mark scheme
Comparison
C1
for a correct comparison of medians, eg. the median delay time on Mon was greater than the median delay time on Tues. or ft (a)
C1
for a correct comparison of a measure of spread, eg. the interquartile range (range) of delay times on Mon was greater than the interquartile range (range) of delay times on Tues. or ft (a) For the award of both marks at least one of the comparisons must be in context
Additional guidance
Simply quoting values for median, range and IQR is insufficient, they must be compared
Comparisons can relate to the median, and then either the range or the IQR.
Mark scheme (c)
Answer
Mark
Mark scheme
statement
C1
‘No’ with statement explaining that there might not be any delays between 25 minutes and 30 minutes as in the upper 25% (12 trains) the delays may all be between 17 and 25 or 30 and 33
Additional guidance
The ‘No’ may be implied from their wording, and could be written next to the “?” The statement must mention (or imply) values above the UQ of 17
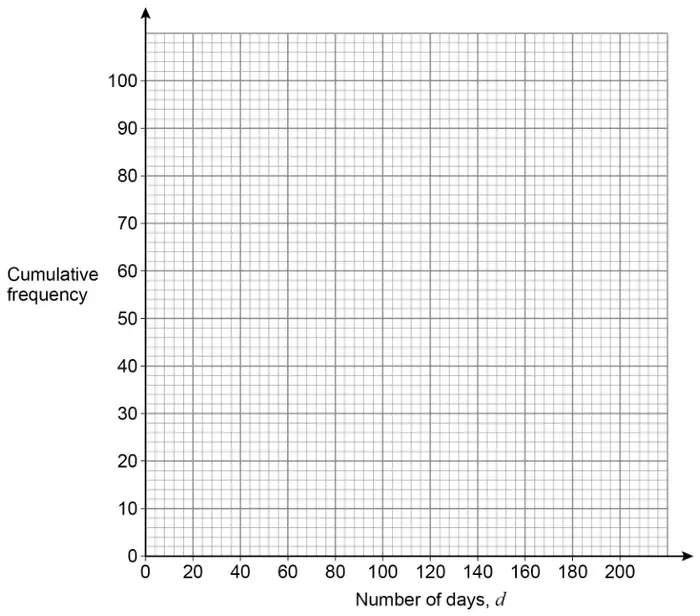
The number of days each battery lasted was recorded.
(a) The frequency table represents the results for type P.
Number of days, \(d\)
Frequency
\(0 \leqslant d \lt 40\)
2
\(40 \leqslant d \lt 80\)
9
\(80 \leqslant d \lt 120\)
26
\(120 \leqslant d \lt 160\)
45
\(160 \leqslant d \lt 200\)
18
On the grid, draw a cumulative frequency diagram to represent the data. [3 marks]
(b) For type Q,
the median was 126 days the interquartile range was 57 days.
Compare the number of days that types P and Q lasted.
Make one statement about the average and one statement about the spread.
Use statistical measures to support your statements. [4 marks]
Mark scheme (a)
Answer
Mark
Comments
2 11 37 82 100
B1
may be implied by plots
Correct cf diagram with points joined with a smooth curve or lines
B2ft
\(\pm \dfrac{1}{2}\) small square ft their cf values which must be increasing for B2 or B1 B1ft cf diagram with all points plotted at their heights but not at correct horizontal positions or cf diagram with all points plotted at correct horizontal positions with at least 4 of their heights correct or all points plotted correctly at their heights but cf diagram not drawn or drawn poorly
Additional guidance
Ignore diagram to the left of their (40, 2)
For B2ft the diagram must end at (200, their 100) unless followed by a horizontal line
Histogram only
Max B1B0
Histogram and cf diagram
Mark the cf diagram
Mark scheme (b)
Answer
Mark
Comments
Correct median for their cumulative frequency diagram
B1ft
ft their diagram which must be increasing \(\pm \dfrac{1}{2}\) small square
Correct comparison of their type P median with 126
B1ft
answers must be in context eg P lasts longer or P is better
Correct interquartile range for their cumulative frequency diagram
B1ft
ft their diagram which must be increasing \(\pm \dfrac{1}{2}\) small square
Correct comparison of their type P interquartile range with 57
B1ft
answers must be in context eg P is more consistent or P is more reliable or Q is more varied
Additional guidance
2nd and 4th marks - ignore irrelevant or incorrect statements alongside a correct statement as long as not contradictory
eg (P median = 132) P lasts longer by 8 (error) minutes
2nd B1
P’s average is bigger
2nd B0
P’s median is greater
2nd B0
P’s spread is smaller
4th B0
P’s IQR is lower
4th B0
Q is more spread out
4th B0
2nd and 4th marks can be awarded even if their diagram is not increasing
2nd and 4th marks can be awarded even if the methods used for P’s median and IQR are incorrect
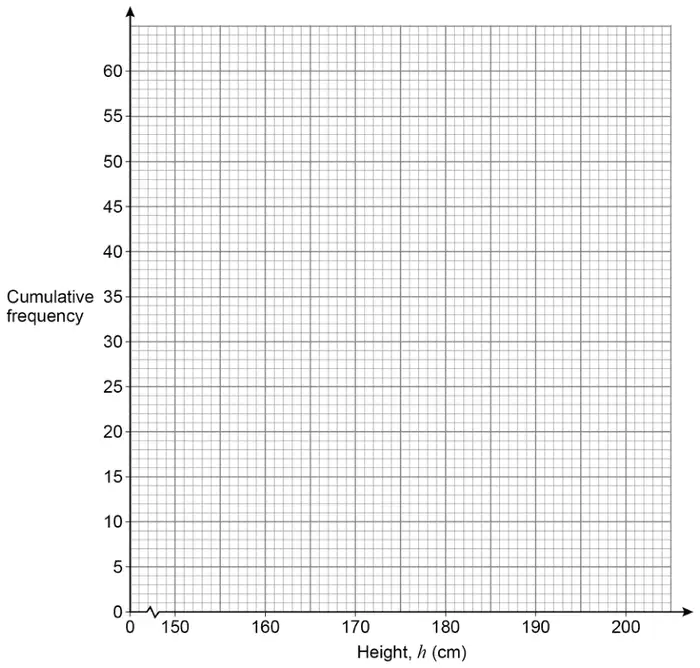
17 The table shows information about the heights of 60 athletes.
Height, \(h\) (cm)
Frequency
\(150 \lt h \leqslant 160\)
4
\(160 \lt h \leqslant 170\)
12
\(170 \lt h \leqslant 180\)
35
\(180 \lt h \leqslant 190\)
7
\(190 \lt h \leqslant 200\)
2
(a) Complete the cumulative frequency table. [1 mark]
Height, \(h\) (cm)
Cumulative frequency
\(h \leqslant 150\)
0
\(h \leqslant 160\)
4
\(h \leqslant 170\)
16
\(h \leqslant 180\)
\(h \leqslant 190\)
\(h \leqslant 200\)
(b) Circle the class interval that contains the lower quartile. [1 mark]
\(150 \lt h \leqslant 160\)
\(160 \lt h \leqslant 170\)
\(170 \lt h \leqslant 180\)
\(180 \lt h \leqslant 190\)
(c) Draw a cumulative frequency diagram to represent the data. [2 marks]
(d) Estimate the number of the athletes whose height is more than 176 cm [2 marks]
Mark scheme (a)
Answer
Mark
Comments
51, 58 and 60
B1
Mark scheme (b)
Answer
Mark
Comments
\(160 \lt h \leqslant 170\)
B1
Mark scheme (c)
Answer
Mark
Comments
Points plotted with upper class boundaries and cf values condone (150, 0) omitted or incorrectly plotted for this mark only
B1ft
\(\pm\dfrac{1}{2}\) square ft their cumulative frequencies, which must be increasing ignore bars drawn if points clearly plotted
Smooth curve or polygon
B1ft
ft their 5 or 6 points (point with cf 0 may be omitted) must be increasing and not a single straight line
Additional guidance
For the second mark, the points must be evenly spaced accept an omission of the point with cf 0, but do not accept an incorrect starting point for the pattern of their points accept a horizontal line drawn from their final point, but do not accept a continuation of the curve or polygon
Points plotted at lower class boundaries or midpoints, but with correct smooth curve or polygon for their points
B0B1
Bars drawn with correct curve
B1B1
Bars drawn without curve but with correct points clearly plotted
B1B0
Bars drawn without correct curve or correct points plotted
B0B0
Mark scheme (d)
Answer
Mark
Comments
Alternative method 1
Vertical line drawn from 176 to curve or polygon
M1
implied by correct reading for their increasing curve or polygon or mark at correct place on their increasing curve or polygon or on the vertical axis \(\pm\dfrac{1}{2}\) square
Correct value for \(60 -\) their reading or correct value for their \(60 -\) their reading
A1ft
ft their increasing curve or polygon answer must be an integer their 60 must be from an increasing curve or polygon
Alternative method 2
\(2 + 7 + \dfrac{4}{10} \times 35\) or \(2 + 7 + 14\) or \(4 + 12 + \dfrac{6}{10} \times 35\) or \(4 + 12 + 21\) or 37
M1
23
A1
Additional guidance
In alternative method 1 condone the curve or polygon drawn only for the required section (170 – 180) as long as the cumulative frequencies are increasing throughout
Answer 23 not from alternative method 2 must match their graph
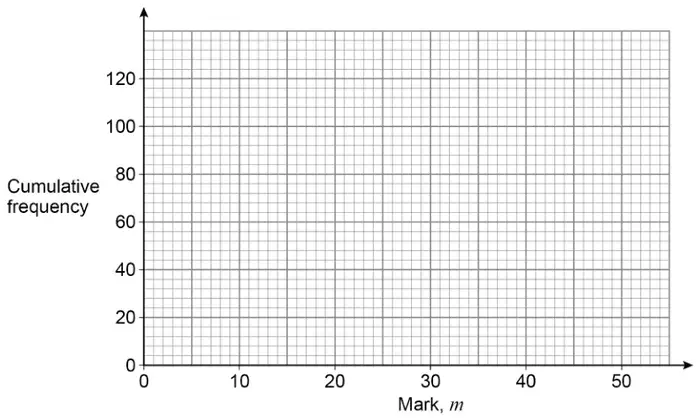
15 Here is some information about the test marks of 120 students.
Mark, \(m\)
\(0 < m \leqslant 10\)
\(10 < m \leqslant 20\)
\(20 < m \leqslant 30\)
\(30 < m \leqslant 40\)
\(40 < m \leqslant 50\)
Frequency
20
28
40
20
12
(a) Complete the cumulative frequency table. [1 mark]
Mark, \(m\)
\(m \leqslant 10\)
\(m \leqslant 20\)
\(m \leqslant 30\)
\(m \leqslant 40\)
\(m \leqslant 50\)
Cumulative frequency
20
48
(b) Draw a cumulative frequency graph. [2 marks]
(c) Students who scored 15 marks or fewer take another test.
Use your graph to estimate how many students take another test. [2 marks]
Mark scheme (a)
Answer
Mark
Comments
(20 48) 88 108 120
B1
Mark scheme (b)
Answer
Mark
Comments
All 5 points plotted using upper class bounds and their cf values
M1
\(\pm \dfrac{1}{2}\) small square must be increasing
Smooth curve or polygon for their cf values
A1ft
\(\pm \dfrac{1}{2}\) small square must be increasing
Additional guidance
If (a) is correct, points should be at (10, 20), (20, 48), (30, 88), (40, 108) and (50, 120)
For A1, the graph should start at (0, 0) or (1, 0) or (10, 20)
For A1, the graph should end at \(m = 50\) unless it followed by a horizontal line adjoining (50, 120)
Histogram only
M0A0
Histogram and graph
Mark curve
Mark scheme (c)
Answer
Mark
Comments
Line from 15 marks to their graph
M1
\(\pm \dfrac{1}{2}\) small square implied by mark at correct place on the graph or on the vertical axis (but not on the horizontal axis) or by correct reading from their graph
Correct reading from their graph for 15 marks
A1ft
\(\pm \dfrac{1}{2}\) small square
Additional guidance
Correct reading for their graph, with or without evidence of using graph
M1A1
No graph in (b)
M0A0
For M1 and A1ft the domain of their graph must be at least \(10 \leqslant m \leqslant 20\) and their graph must be increasing in the domain \(10 \leqslant m \leqslant 50\) or from \(m = 10\) if their graph does not extend to \(m = 50\)
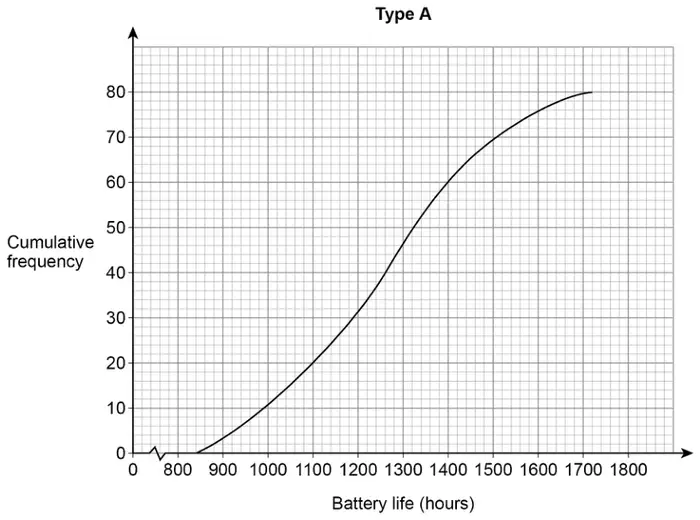
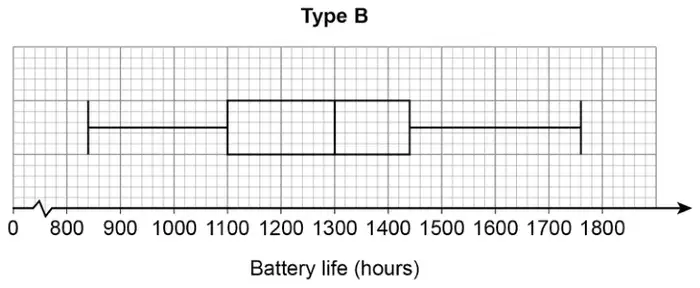
19 Type A batteries and type B batteries were tested.
The cumulative frequency diagram shows information about the battery life of type A.
(a) Estimate the interquartile range for type A. [2 marks]
(b) Estimate the number of type A batteries that had a battery life of more than 1600 hours. [1 mark]
(c) The box plot shows information about the battery life of type B.
On average, which type had the greater battery life?
Tick a box.
type A
type B
Using data from both diagrams, state how you chose your answer. [2 marks]
Mark scheme (a)
Answer
Mark
Comments
300
B2
B1 1100 or 1400 seen
Mark scheme (b)
Answer
Mark
Comments
4
B1
Additional guidance
Ignore incorrect ‘units’ eg 4 people
B1
Mark scheme (c)
Answer
Mark
Comments
Ticks type B and gives valid reason
B2
eg valid reasons (median for A is) 1260 and (median for B is) 1300 median for B is 40 more (than A)
B1 no or incorrect decision and (median for A is) 1260 and (median for B is) 1300 or no or incorrect decision and median for B is 40 more (than A) or ticks type B and (median for B is) 1300 and (median for A is) 1230 or 1280 or ticks type B and B has a larger median (than A) (if one median given it must be correct)
Additional guidance
If median values are not given in the wording, look for values on the graph and box plot
Ticks type B but gives no valid reason
B0
Allow use of average or middle for median, or a correct description eg ‘top 50%’. Do not accept ‘mean’ or ‘mode’ or other statistical measures for median
Ignore comments about measures other than the median
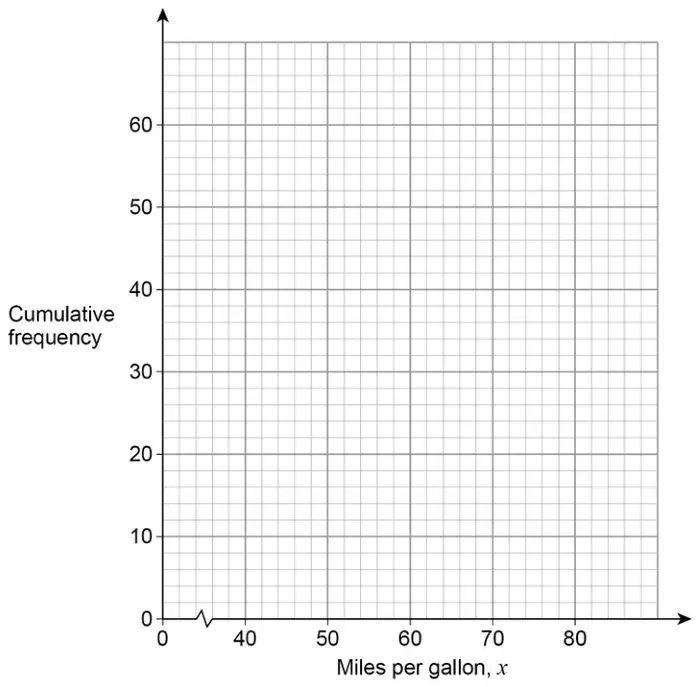
22 Here is some information about the miles per gallon of 60 cars.
Miles per gallon, \(x\)
Frequency
\(40 \lt x \leqslant 50\)
6
\(50 \lt x \leqslant 60\)
16
\(60 \lt x \leqslant 70\)
28
\(70 \lt x \leqslant 80\)
10
(a) Draw a cumulative frequency graph. [3 marks]
(b) Use the graph to work out the interquartile range. [2 marks]
Mark scheme (a)
Answer
Mark
Comments
(6) 22 50 60
B1
cumulative frequency values may be implied by points plotted (\(\pm\) 0.5 square)
Points plotted with upper class boundaries and cf values (\(\pm\) 0.5 square)
B1ft
ft their cumulative frequencies must be increasing
Smooth curve or polygon (\(\pm\) 0.5 square)
B1ft
ft their cumulative frequencies must be increasing and not a single straight line
Additional guidance
Graphs may start from their first plotted point or from (40, 0) If the points are plotted at mid-points, with a point at (45, 6), the graph may start at (35, 0) (\(\pm\) 0.5 square) If the points are plotted at the lower bounds, with a point at (40, 6), the graph may start at (0, 0)
Graph starting at (0, 0), but otherwise correct
B1B1B0
Graph plotted at mid-points or lower class boundaries, but otherwise correct
B1B0B1
Graph ascends or descends after \(x = 80\)
B0 for 3rd mark
Bars drawn as well as correct graph
B1B1B0
Bars drawn without correct graph
max B1
Mark scheme (b)
Answer
Mark
Comments
One correct mpg reading for their graph from cf of 15(.25) or 45(.75) or horizontal lines from 15(.25) and 45(.75) only to their graph or 15(.25) and 45(.75) indicated as the cf values for the quartiles
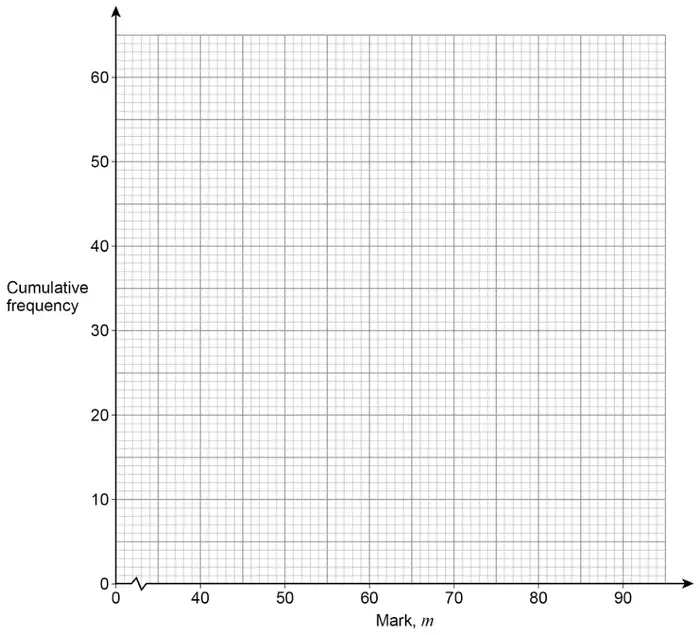
19 Here is some information about the marks of 60 students in a test.
Mark, \(m\)
Frequency
\(40 \lt m \leqslant 50\)
9
\(50 \lt m \leqslant 60\)
16
\(60 \lt m \leqslant 70\)
20
\(70 \lt m \leqslant 80\)
8
\(80 \lt m \leqslant 90\)
7
(a) On the grid, draw a cumulative frequency graph. [3 marks]
(b) Use your graph to estimate the lowest mark of the top 20% of students. [2 marks]
Mark scheme (a)
Answer
Mark
Comments
(9) 25 45 53 60
B1
cumulative frequencies May be implied by points plotted (\(\pm\) 0.5 square)
Points plotted with upper class boundaries and cf values (\(\pm\)0.5 square)
B1ft
ft their cumulative frequencies Must be increasing and not a single straight line
Smooth curve or polygon starting at correct point for their points and going through all their points (\(\pm\)0.5 square)
B1ft
ft their cumulative frequencies Must be increasing and not a single straight line
Additional guidance
Graphs may start from their first plotted point or from (40, 0) If they have plotted their points at mid-points, with point at (45, 9), their graph may start at (35, 0) Graph starting at (0, 0), but otherwise correct
B1B1B0
Curve plotted at mid-points or lower class boundaries, but otherwise correct
B1B0B1
Ignore the graph after \(m = 90\)
Bars drawn as well as correct graph
B1B1B0
Bars drawn without the correct graph
max B1
Mark scheme (b)
Answer
Mark
Comments
Alternative method 1
\(60 - 0.2 \times 60\) or \(60 \times 0.8\) or 48
M1
oe implied by horizontal line from 48 on vertical axis
Correct reading from their increasing graph
A1ft
\(\pm\,\dfrac{1}{2}\) square
Alternative method 2
\(70 + \dfrac{3}{8} \times 10\)
M1
[73, 75]
A1
Additional guidance
The correct answer is likely to be [73, 75] from a correct graph