
Higher November 2018 Paper 2 Q16
16 The cumulative frequency graph shows information about the masses of 50 apples.
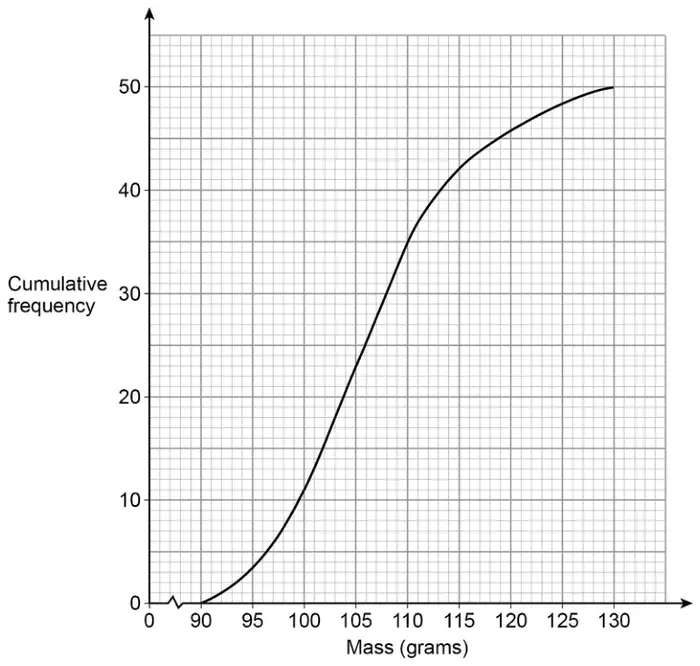
(a) Use the graph to estimate the median mass of the apples. [1 mark]
(b) Estimate the proportion of the apples that have a mass greater than 115 grams. [2 marks]
| Answer | Mark | Comments |
|---|---|---|
| 106 | B1 |
| Answer | Mark | Comments |
|---|---|---|
| 50 − 42 or 8 or \(\dfrac{42}{50}\) or \(\dfrac{21}{25}\) or 0.84 or 84% | M1 | oe |
| \(\dfrac{8}{50}\) or \(\dfrac{4}{25}\) or 0.16 or 16% | A1 | oe |
Additional guidance
| Ignore incorrect conversion if correct answer seen | |
| \(\dfrac{8}{42}\) | M1A0 |