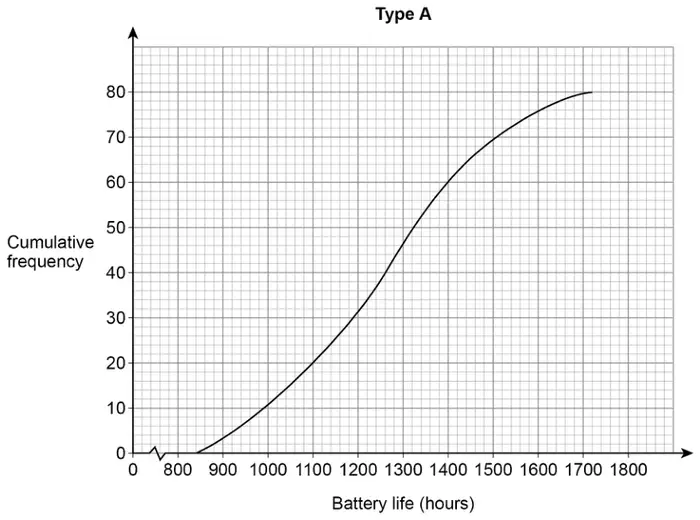
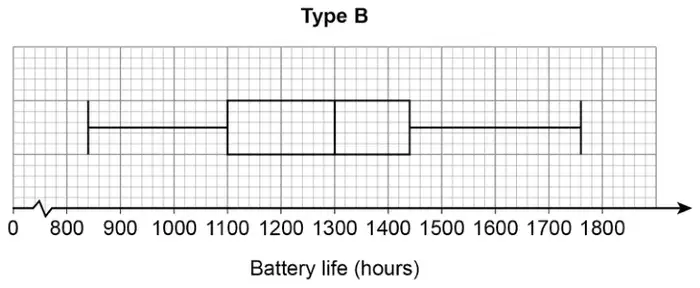
19 Type A batteries and type B batteries were tested.
The cumulative frequency diagram shows information about the battery life of type A.
(a) Estimate the interquartile range for type A. [2 marks]
(b) Estimate the number of type A batteries that had a battery life of more than 1600 hours. [1 mark]
(c) The box plot shows information about the battery life of type B.
On average, which type had the greater battery life?
Tick a box.
type A
type B
Using data from both diagrams, state how you chose your answer. [2 marks]
Mark scheme (a)
Answer
Mark
Comments
300
B2
B1 1100 or 1400 seen
Mark scheme (b)
Answer
Mark
Comments
4
B1
Additional guidance
Ignore incorrect ‘units’ eg 4 people
B1
Mark scheme (c)
Answer
Mark
Comments
Ticks type B and gives valid reason
B2
eg valid reasons (median for A is) 1260 and (median for B is) 1300 median for B is 40 more (than A)
B1 no or incorrect decision and (median for A is) 1260 and (median for B is) 1300 or no or incorrect decision and median for B is 40 more (than A) or ticks type B and (median for B is) 1300 and (median for A is) 1230 or 1280 or ticks type B and B has a larger median (than A) (if one median given it must be correct)
Additional guidance
If median values are not given in the wording, look for values on the graph and box plot
Ticks type B but gives no valid reason
B0
Allow use of average or middle for median, or a correct description eg ‘top 50%’. Do not accept ‘mean’ or ‘mode’ or other statistical measures for median
Ignore comments about measures other than the median