
Higher November 2017 Paper 3 Q13
13 Here is some information about the length of time cars stayed in a car park.
| Shortest time | 30 minutes | Lower quartile | 2 hours |
| Longest time | 12 hours | Interquartile range | 3 hours |
| Median time | 4 hours |
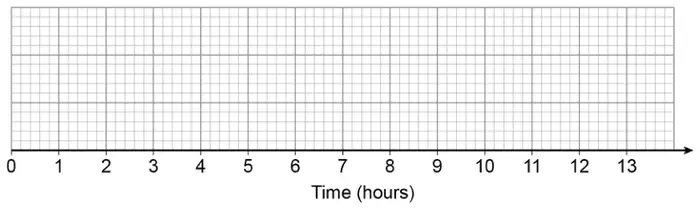
Draw a box plot to show this information. [3 marks]
| Answer | Mark | Comments |
|---|---|---|
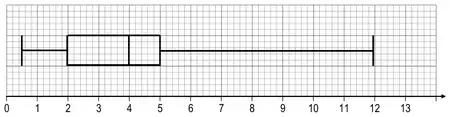
| Fully correct box plot Minimum = 0.5 LQ = 2 Median = 4 UQ = 5 Maximum = 12 | B3 | B2 for box plot with 3 or 4 correct plots or 1 omission B1 for at least 3 correct plots tolerance \(\pm \dfrac{1}{2}\) square |
Additional guidance
 | |
| Any indication of correct plots | |
| Whiskers may be omitted | |
| Not a box plot scores a maximum of B1 | |
| ½, 2, 3, 4, 12 plotted correctly in a box plot | B2 |
| ½, 2, 3, 4, 12 plotted correctly in a box plot with one point out of tolerance | B1 |
| ½, 2, 3, 4, 12 not in a box plot | B1 |