
Higher November 2021 Paper 1 Q16
16 The cumulative frequency graph represents the masses of 40 necklaces.
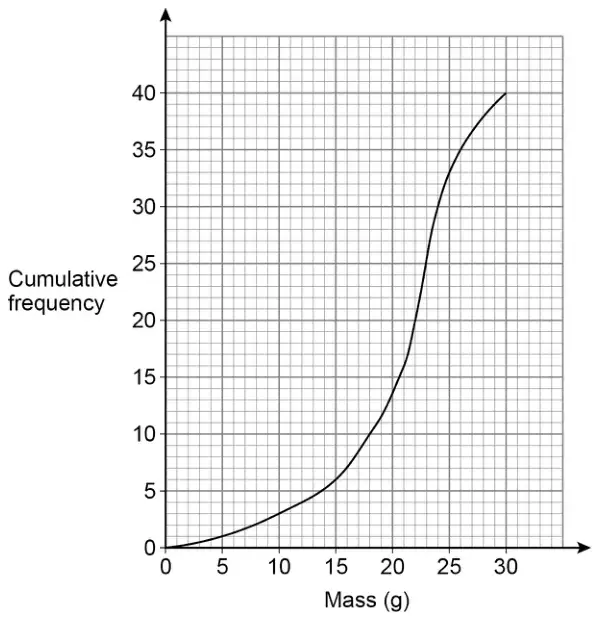
(a) A jeweller buys every necklace with mass greater than 21 grams.
Use the graph to estimate how many she buys. [2 marks]
(b) The lowest mass was 3 grams.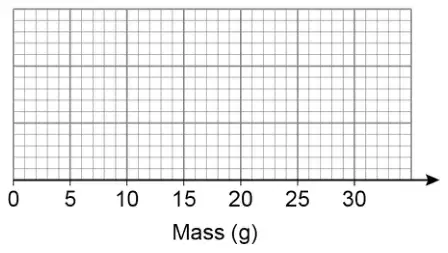
The highest mass was 28 grams.
Draw a box plot to represent the data. [3 marks]
| Answer | Mark | Comments |
|---|---|---|
| Vertical line from 21 to [15, 17] or 16 | M1 | implied by correct point marked on curve or vertical axis |
| 24 | A1 | SC1 23 or 25 |
| Answer | Mark | Comments |
|---|---|---|
| (Median =) 22 | B1 | in working or in box plot |
| (LQ =) 18 and (UQ =) 24 | B1 | in working or in box plot |
| Rectangular box with median line and whiskers to 3 and 28 | B1 |
Additional guidance
Median and quartiles may be seen on cumulative frequency diagram
If the values for the median and/or the LQ and UQ are correct in working but incorrect in the box plot award up to B1B1B0