
Higher November 2020 Paper 3 Q20
20 Amari and Ben each play a game.
(a) Here is some information about Amari’s scores.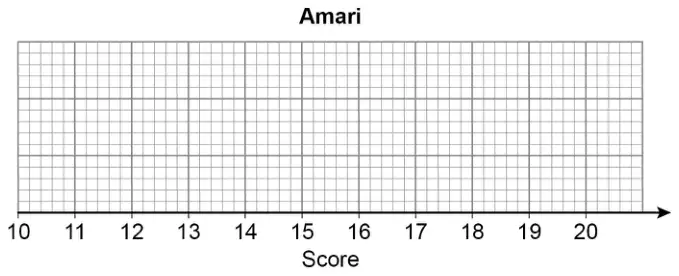
Lowest 12
Highest 20
Lower quartile 13
Upper quartile 19
Median 17
Draw a box plot to represent his scores. [2 marks]
(b) This box plot represents Ben’s scores.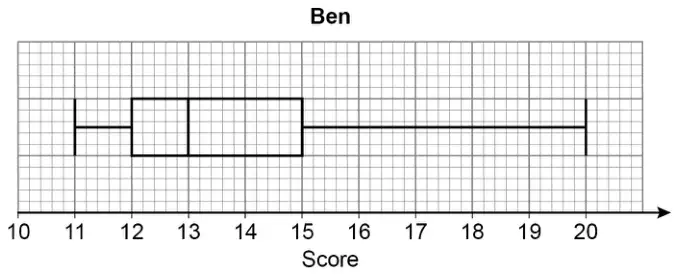
Who had more consistent scores, Amari or Ben?
Work out the interquartile ranges to support your answer. [2 marks]
| Answer | Mark | Comments |
|---|---|---|
| Fully correct box plot | B2 | B1 three correctly positioned measures |
Additional guidance
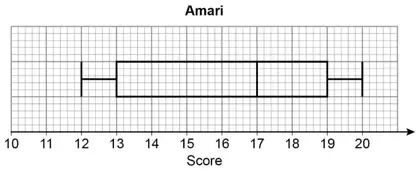 | B2 |
| Does not need to be ruled, mark intention ± ½ square | |
| Whiskers must stop at 12 and 20 for B2 | |
| Whiskers must reach 12 and 20 for B2 |
| Answer | Mark | Comments |
|---|---|---|
| (Ben IQR =) 3 and (Amari IQR =) 6 and Ben | B2 | B1 (Ben IQR =) 3 or (Amari IQR =) 6 or Ben and his box is smaller or Ben and his IQR is smaller |
Additional guidance
| Ben’s IQR is 3 smaller than Amari’s | B2 |
| Statement based only on incorrect IQR values | B0 |
| Ben | B0 |
| Only using range | B0 |