
Higher November 2023 Paper 3 Q13
13 Alan grew 80 plants of the same type outside.
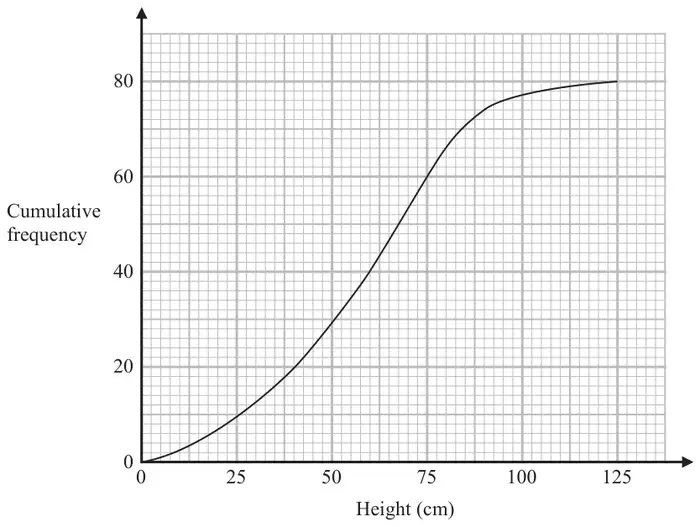
The cumulative frequency graph shows information about the heights, in cm, of these plants.
One of the plants is chosen at random.
(a) Find an estimate for the probability that this plant will have a height greater than 90 cm. (2)
(b) Use the graph to find an estimate for the median height. (1)
(c) Use the graph to find an estimate for the interquartile range of the heights. (2)
Alan also grew plants of the same type inside.
The interquartile range of the heights of these plants is 30 cm.
(d) Give one comparison between the distribution of the heights of the plants grown inside with the distribution of the heights of the plants grown outside. (1)
| Answer | Mark | Mark scheme |
|---|---|---|
| \(\dfrac{6}{80}\) | M1 | for correct method using the graph at 90 cm, eg \(80 - 74\ (= 6)\) |
| A1 | for \(\dfrac{6}{80}\) oe, accept \(\dfrac{5}{80}\) oe |
Additional guidance
Accept \(80 - 75\ (= 5)\)
Accept any equivalent fraction, decimal (0.075) or percentage (7.5%)
| Answer | Mark | Mark scheme |
|---|---|---|
| 60 | B1 | for answer in the range 58.5 – 61.5 |
| Answer | Mark | Mark scheme |
|---|---|---|
| 35 | M1 | for UQ = 75 or LQ = 40 |
| A1 | for answers in the range 34 to 36 or ft acceptable readings from the graph |
Additional guidance
Allow UQ in range 74 to 76
Allow LQ in range 39 to 41
Value(s) may be seen on graph
| Answer | Mark | Mark scheme |
|---|---|---|
| Comparison made | C1 | (ft) for a correct comparison of the IQRs eg the heights of the plants grown outside are more varied or the IQR of the plants grown outside is 35 cm but the IQR of the plants grown inside is only 30 cm. |
Additional guidance
The comparison must include some context (eg refers to heights or cm)
Ignore any additional information provided there is no contradiction.
Figures need not be seen but if given they must be correct.