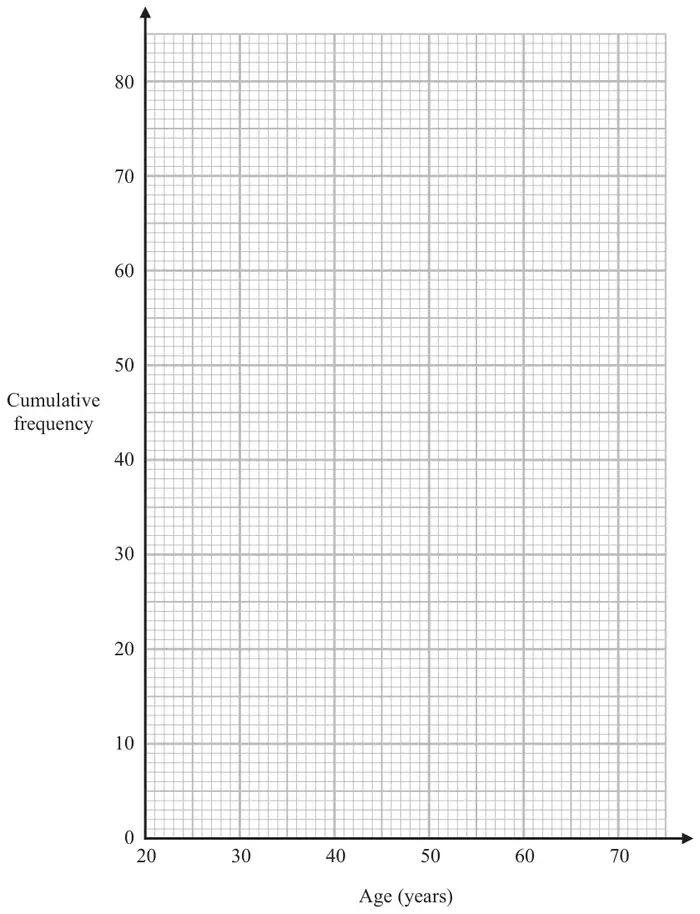
for 4 or 5 points plotted correctly from the cumulative frequency table
A1
for a fully correct graph SCB1 if 4 or 5 points plotted not at end but consistent within each interval and joined by a curve or line segments providing no gradient is negative
Additional guidance
Ignore to the left of the first point and right of the last point If histograms drawn, points must be identified