
Higher November 2023 Paper 2 Q17
17 190 people were asked how much they spent on takeaways one month.
The table shows information about the results.
| Amount, \(x\) (£) | Cumulative frequency |
|---|---|
| \(0 \lt x \leqslant 10\) | 16 |
| \(0 \lt x \leqslant 20\) | 64 |
| \(0 \lt x \leqslant 30\) | 140 |
| \(0 \lt x \leqslant 40\) | 184 |
| \(0 \lt x \leqslant 50\) | 190 |
(a) How many people spent more than £20 ? [2 marks]
(b) Farah draws this cumulative frequency curve to represent the results.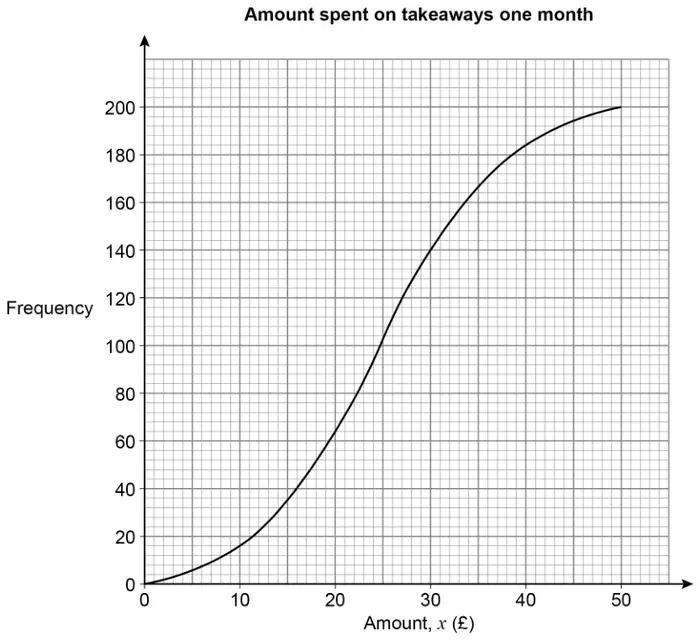
Give two criticisms of her graph. [2 marks]
| Answer | Mark | Comments |
|---|---|---|
| \(190 - 64\) or \(140 - 64\) or \(184 - 140\) or \(190 - 184\) or 76 or 44 or 6 | M1 | oe may be seen in table |
| 126 | A1 |
| Answer | Mark | Comments |
|---|---|---|
| Valid criticism involving incorrect point | B1 | eg (50, 200) should be (50, 190) |
| Valid criticism involving vertical axis label | B1 | eg frequency should be cumulative frequency |
Additional guidance
| Ignore irrelevant additional criticism eg title should include people and (50, 200) should be (50, 190) | B1 |
| Do not ignore incorrect statements eg (50, 200) should be (50, 190) and they should have plotted at the midpoints | B0 |
| The point at 190 is not plotted correctly | B1 |
| A point is plotted incorrectly | B0 |
| Some points are plotted incorrectly | B0 |
| Not all points are plotted correctly | B0 |
| 200 should be 190 (could be referring to the vertical axis) | B0 |
| The graph goes to 200 | B0 |
| Should have used cumulative frequency for the label | B1 |
| Frequency should be changed to cumulative frequency or number of people | B0 |
| Has not labelled it correctly | B0 |
| Should have used cumulative frequency | B0 |
| Her graph shows only frequency not cumulative frequency | B0 |