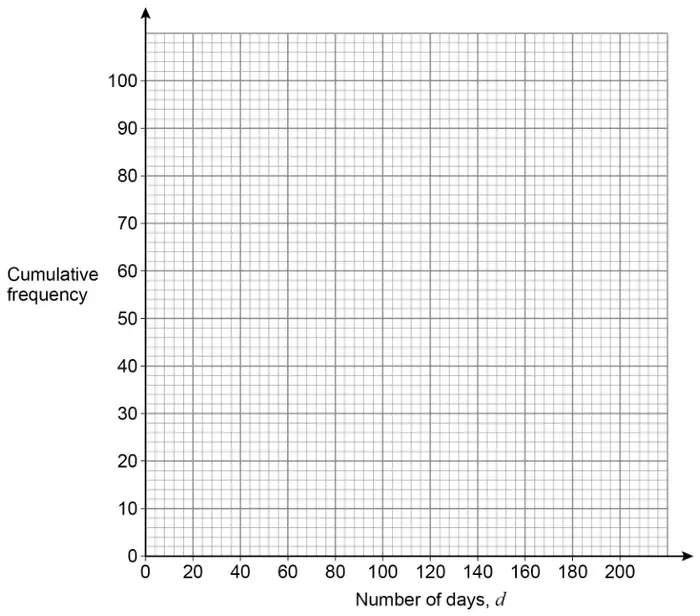
The number of days each battery lasted was recorded.
(a) The frequency table represents the results for type P.
Number of days, \(d\)
Frequency
\(0 \leqslant d \lt 40\)
2
\(40 \leqslant d \lt 80\)
9
\(80 \leqslant d \lt 120\)
26
\(120 \leqslant d \lt 160\)
45
\(160 \leqslant d \lt 200\)
18
On the grid, draw a cumulative frequency diagram to represent the data. [3 marks]
(b) For type Q,
the median was 126 days the interquartile range was 57 days.
Compare the number of days that types P and Q lasted.
Make one statement about the average and one statement about the spread.
Use statistical measures to support your statements. [4 marks]
Mark scheme (a)
Answer
Mark
Comments
2 11 37 82 100
B1
may be implied by plots
Correct cf diagram with points joined with a smooth curve or lines
B2ft
\(\pm \dfrac{1}{2}\) small square ft their cf values which must be increasing for B2 or B1 B1ft cf diagram with all points plotted at their heights but not at correct horizontal positions or cf diagram with all points plotted at correct horizontal positions with at least 4 of their heights correct or all points plotted correctly at their heights but cf diagram not drawn or drawn poorly
Additional guidance
Ignore diagram to the left of their (40, 2)
For B2ft the diagram must end at (200, their 100) unless followed by a horizontal line
Histogram only
Max B1B0
Histogram and cf diagram
Mark the cf diagram
Mark scheme (b)
Answer
Mark
Comments
Correct median for their cumulative frequency diagram
B1ft
ft their diagram which must be increasing \(\pm \dfrac{1}{2}\) small square
Correct comparison of their type P median with 126
B1ft
answers must be in context eg P lasts longer or P is better
Correct interquartile range for their cumulative frequency diagram
B1ft
ft their diagram which must be increasing \(\pm \dfrac{1}{2}\) small square
Correct comparison of their type P interquartile range with 57
B1ft
answers must be in context eg P is more consistent or P is more reliable or Q is more varied
Additional guidance
2nd and 4th marks - ignore irrelevant or incorrect statements alongside a correct statement as long as not contradictory
eg (P median = 132) P lasts longer by 8 (error) minutes
2nd B1
P’s average is bigger
2nd B0
P’s median is greater
2nd B0
P’s spread is smaller
4th B0
P’s IQR is lower
4th B0
Q is more spread out
4th B0
2nd and 4th marks can be awarded even if their diagram is not increasing
2nd and 4th marks can be awarded even if the methods used for P’s median and IQR are incorrect