
Higher June 2017 Paper 2 Q8
8 The cumulative frequency graph shows some information about the heights, in cm, of 60 students.
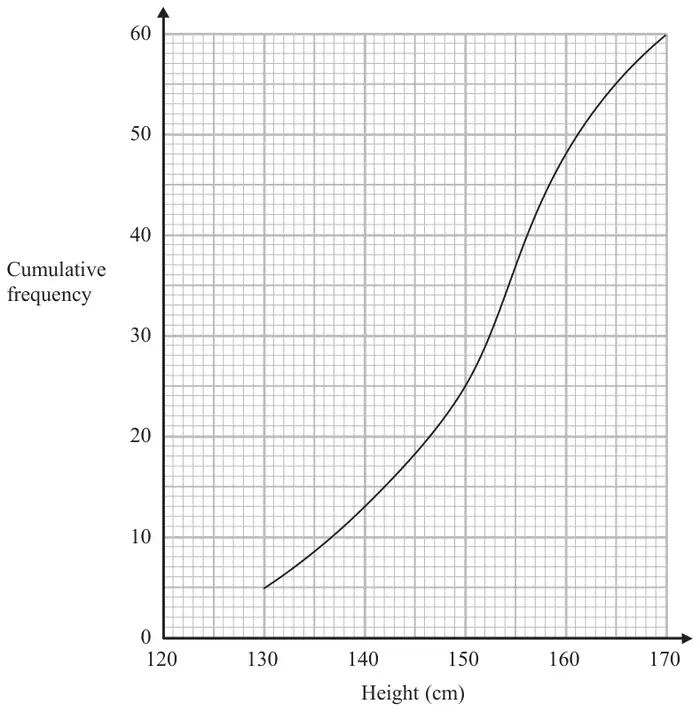
Work out an estimate for the number of these students with a height greater than 160 cm. (2)
| Answer | Mark | Notes |
|---|---|---|
| 12 | M1 | for evidence of taking a reading from the graph from \(h = 160\) |
| A1 | for answer in the range 11.8 to 12.2 |