
Higher June 2025 Paper 3 Q13
13 The table shows information about the salary of 90 employees.
| Salary, \(s\) (£) | Frequency |
|---|---|
| \(0 \lt s \leqslant 20\,000\) | 44 |
| \(20\,000 \lt s \leqslant 40\,000\) | 22 |
| \(40\,000 \lt s \leqslant 60\,000\) | 14 |
| \(60\,000 \lt s \leqslant 80\,000\) | 5 |
| \(80\,000 \lt s \leqslant 100\,000\) | 2 |
| \(100\,000 \lt s \leqslant 120\,000\) | 3 |
(a) Complete the cumulative frequency table. [1 mark]
| Salary, \(s\) (£) | Cumulative Frequency |
|---|---|
| \(s \leqslant 20\,000\) | 44 |
| \(s \leqslant 40\,000\) | 66 |
| \(s \leqslant 60\,000\) | |
| \(s \leqslant 80\,000\) | |
| \(s \leqslant 100\,000\) | |
| \(s \leqslant 120\,000\) |
(b) Draw a cumulative frequency diagram to represent the data. [2 marks]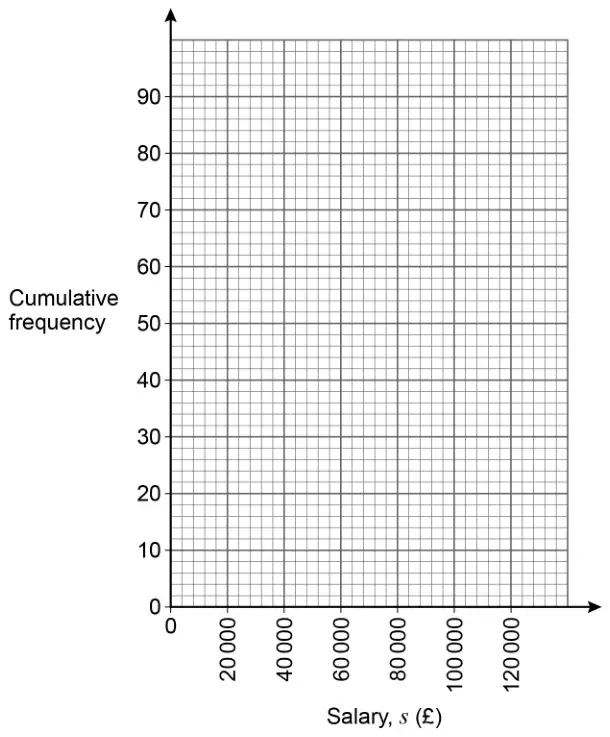
(c) Estimate the number of employees with a salary less than £32 000 [2 marks]
| Answer | Mark | Comments |
|---|---|---|
| 80, 85, 87, 90 | B1 | may be implied by correct graph |
| Answer | Mark | Comments |
|---|---|---|
| Six points plotted using upper class bounds and their cf values | B1ft | \(\pm \dfrac{1}{2}\) square ft their cf values from part (a), which must be increasing may be implied by correct graph |
| Polygon or smooth curve through (20 000, 44), (40 000, 66), (60 000, 80), (80 000, 85), (100 000, 87) and (120 000, 90) | B1 | \(\pm \dfrac{1}{2}\) square ignore any bars drawn |
Additional guidance
For B2 the graph must start at (0, 0) or (20 000, 44) and end at (120 000, 90) unless followed by a horizontal line
| Answer | Mark | Comments |
|---|---|---|
| Vertical line drawn from 32 000 to curve or polygon | M1 | \(\pm \dfrac{1}{2}\) square implied by a mark at the correct place on the curve or the vertical axis |
| [56, 60] or correct reading for their increasing curve or polygon | A1ft | ft their increasing curve or polygon |
Additional guidance
| Do not ignore further working when their increasing curve or polygon is used | |
| Value in range on answer line | M1A1 |