
1MA0 Higher November 2012 Paper 2 Q24
24 The table gives information about the heights, \(h\) metres, of trees in a wood.
| Height (\(h\) metres) | Frequency |
|---|---|
| \(0 \lt h \leqslant 2\) | 7 |
| \(2 \lt h \leqslant 4\) | 14 |
| \(4 \lt h \leqslant 8\) | 18 |
| \(8 \lt h \leqslant 16\) | 24 |
| \(16 \lt h \leqslant 20\) | 10 |
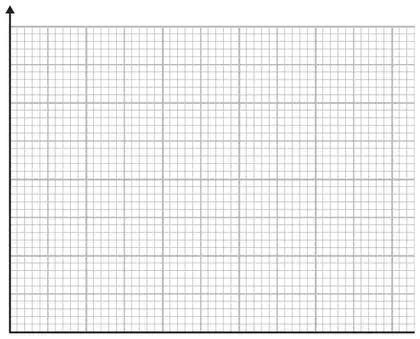
Draw a histogram to show this information. (3)
| Working | Answer | Mark | Notes | ||||||||||||||||||
|---|---|---|---|---|---|---|---|---|---|---|---|---|---|---|---|---|---|---|---|---|---|
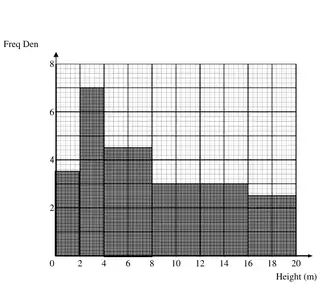 | Correct histogram | 3 | B3 fully correct histogram with horizontal axis correctly scaled (B2 for 4 correct blocks or 5 correct blocks with incorrect or no scale ) (B1 for 2 correct blocks of different widths or any 3 correct blocks) SC : B1 for key, eg. 1 cm2 = 2 (trees) or correct values shown for (freq ÷ class interval) for at least 3 frequencies (3.5, 7, 4.5, 3, 2.5) |
Notes
(corrected from the printed mark scheme: the Answer column is printed as “3”)