
Higher November 2021 Paper 4 Q13
13 The height, \(h\) cm, of each member of a tennis club is recorded.
The histogram shows some of the results.
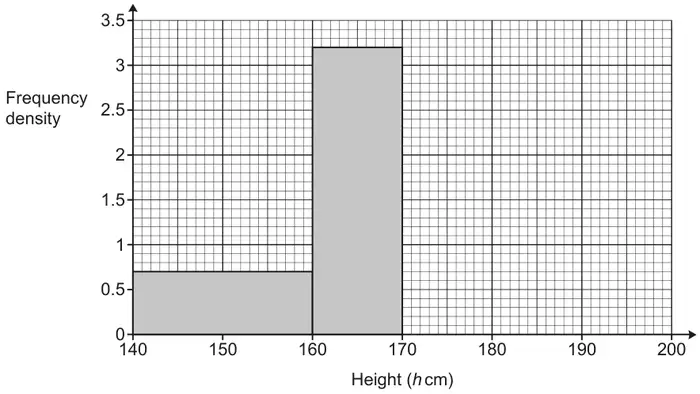
40% of the members have a height in the interval \(160 \leqslant h < 170\).
30% of the members have a height in the interval \(170 \leqslant h < 180\).
100% of the members have a height in the interval \(140 \leqslant h < 200\).
Complete the histogram for the intervals \(170 \leqslant h < 180\) and \(180 \leqslant h < 200\). [6]
| Answer | Marks | Part marks and guidance | |
|---|---|---|---|
| First bar (\(170 \leqslant h < 180\)) at ‘height’ 2.4 Second bar (\(180 \leqslant h < 200\)) at height 0.5 | 6 | M2 for \(\dfrac{3.2 \times 3 \times 10}{4 \times 10}\) oe or M1 for 3.2 × 10 B1 for their bar correctly drawn at \(\dfrac{\textit{their } 24}{10}\) | M2 implied by ‘first bar height’ 2.4 M1 implied by 24, 32 or 80 |
| AND M2 for \(\dfrac{\textit{their } 80 - \textit{their } 24 - 32 - \textit{their } 0.7 \times 20}{20}\) oe or M1 for their 80 – their 24 – 32 – their 0.7 × 20 oe AND B1 for their bar correctly drawn at \(\dfrac{\textit{their } 10}{20}\) | M2 implied by ‘second bar’ height 0.5 M1 implied by 10 | ||