
Higher November 2023 Paper 2 Q15
15 The incomplete table and the incomplete histogram give information about the times taken by some students to run a race.
| Time (\(t\) seconds) | Frequency |
|---|---|
| \(10 \lt t \leqslant 12\) | |
| \(12 \lt t \leqslant 16\) | 10 |
| \(16 \lt t \leqslant 19\) | 15 |
| \(19 \lt t \leqslant 21\) | 9 |
| \(21 \lt t \leqslant 26\) | 7 |
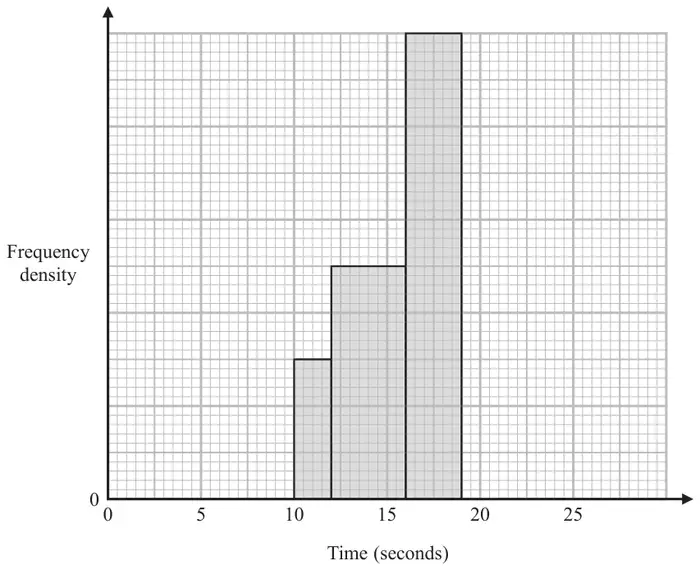
None of these students had a time for the race such that \(t \leqslant 10\) or \(t \gt 26\)
(a) Use the histogram to complete the table. (1)
(b) Use the table to complete the histogram. (2)
The histogram below gives information about the times taken by 43 students to run a different race.
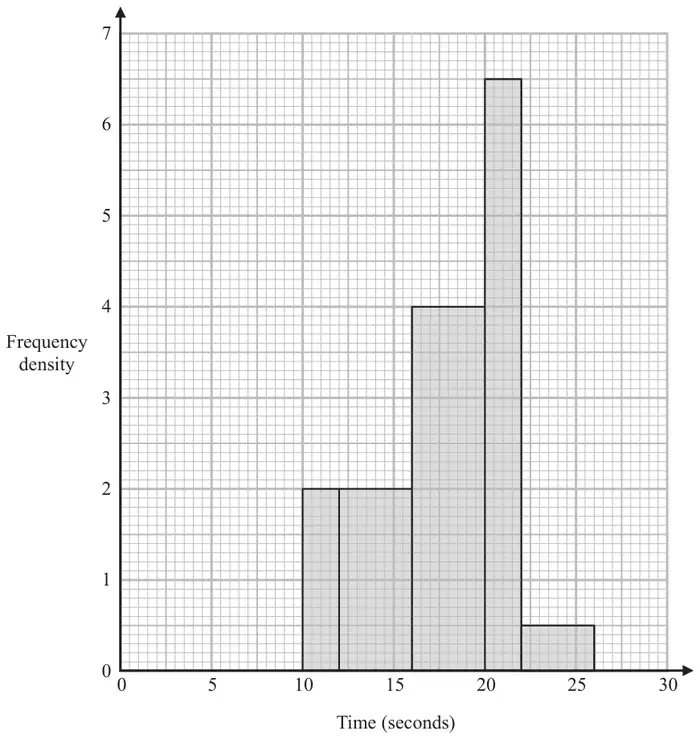
(c) Work out an estimate for the median of the times taken by these 43 students to run the race. (3)
| Answer | Mark | Mark scheme |
|---|---|---|
| 3 | B1 | for 3 correctly placed in the first row |
| Answer | Mark | Mark scheme |
|---|---|---|
| Correct bars | B2 | for both bars correct, heights of 4.5 and 1.4 |
| (B1 | for one bar correct out of a maximum of 2 bars) |
| Answer | Mark | Mark scheme |
|---|---|---|
| 18.5 | M1 | for finding the area of at least 2 bars eg, \(2 \times 2\ (= 4)\) or \(4 \times 2\ (= 8)\) or \(4 \times 4\ (= 16)\) or \(2 \times 6.5\ (= 13)\) or \(4 \times 0.5\ (= 2)\) |
| M1 | for \((\text{``}43\text{''} + 1) \div 2\ (= 22)\) and \(10 \div 16 \times 4\ (= 2.5)\) or \(\text{``}43\text{''} \div 2\ (= 21.5)\) and \(9.5 \div 16 \times 4\ (= 2.375)\) | |
| A1 | For 18.5 or 18.375 |
Additional guidance
Condone 1 error in reading fd values or measurements.