
Higher June 2023 Paper 2 Q16
16 The histogram gives information about the number of hours some students used their phones last week.
The histogram is incomplete.
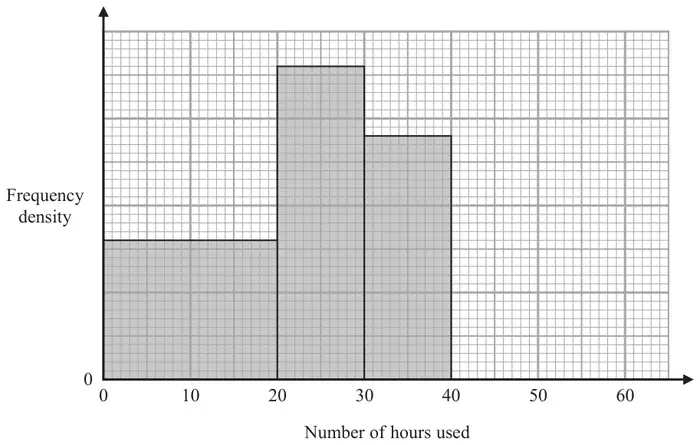
28 students used their phones for between 30 and 40 hours.
24 students used their phones for between 40 and 60 hours.
(a) Use this information to complete the histogram. (2)
No student used their phone for more than 60 hours.
(b) Work out the total number of students. (2)
| Answer | Mark | Mark scheme |
|---|---|---|
| Bar of height 2.4 cm (fd = 1.2) drawn for interval 40 – 60 hours | M1 | for using area to represent frequency, eg 11.2 (cm2) represents 28 (students) or for showing correct scale on fd axis, 2 cm = 1 unit or correct process to find the height of bar, eg \(\dfrac{28}{10}\ (= 2.8)\) or \(\dfrac{24}{20}\ (= 1.2)\) |
| A1 | cao |
Additional guidance
May use any unit of area. Can be implied by frequency of 32 or 36.
Can ignore scale if bar is correct
| Answer | Mark | Mark scheme |
|---|---|---|
| 120 | M1 | ft their histogram for method to find total frequency, eg \((1.6 \times 20) + (3.6 \times 10) + 28 + 24\) oe or for method to find total area under the histogram, eg \((4 \times 3.2) + (2 \times 7.2) + (2 \times 5.6) + (4 \times 2.4)\ (= 48)\) oe |
| A1 | for 120 ft |
Additional guidance
Condone 1 error in reading fd values or measurements.