
1MA0 Higher November 2016 Paper 1 Q23
23 The incomplete histogram and table give some information about the distances some people travel to work.
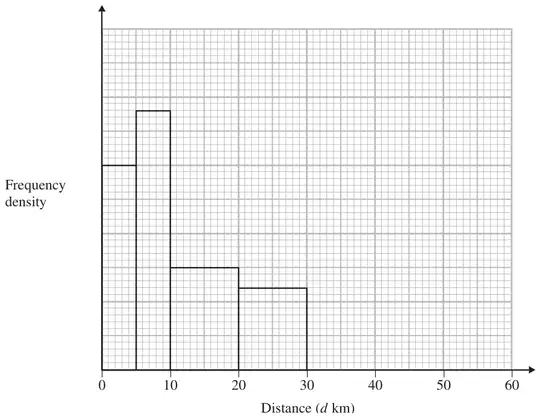
(i) Use the information in the histogram to complete the frequency table.
| Distance (\(d\) km) | Frequency |
|---|---|
| \(0 \lt d \leqslant 5\) | 30 |
| \(5 \lt d \leqslant 10\) | |
| \(10 \lt d \leqslant 20\) | |
| \(20 \lt d \leqslant 30\) | 24 |
| \(30 \lt d \leqslant 50\) | 16 |
(ii) Use the information in the table to complete the histogram.
(3)
| Answer | Mark | Notes |
|---|---|---|
| (i) 38 30 | 3 | M1 for evidence of frequency density calculation, eg 6 on the frequency density axis for the height of the first column or 5 is 1 cm\(^2\) can be implied by 30 as the second missing frequency A1 for 38 and 30 |
| (ii) 30–50 bar height 0.8 cm | B1 for 30 – 50 bar of height 0.8 cm |