
Higher November 2019 Paper 2 Q18
18 The histogram gives information about the heights, in metres, of the trees in a park.
The histogram is incomplete.
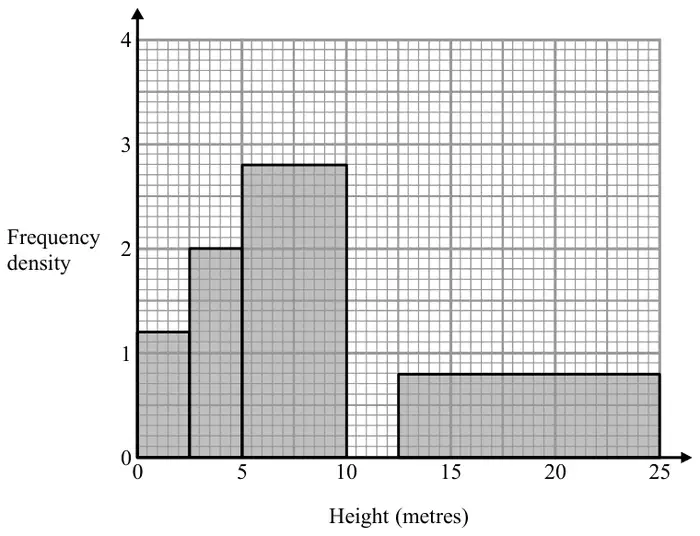
20% of the trees in the park have a height between 10 metres and 12.5 metres.
None of the trees in the park have a height greater than 25 metres.
Complete the histogram. (3)
| Answer | Mark | Mark scheme |
|---|---|---|
| Bar of height 3.2 | M1 | method to find any frequency eg \(1.2 \times 2.5\ (= 3)\) or \(2 \times 2.5\ (= 5)\) or \(2.8 \times 5\ (= 14)\) or \(0.8 \times 12.5\ (= 10)\) or method to use areas eg \(12 \times 5\ (= 60)\) or \(20 \times 5\ (= 100)\) or \(28 \times 10\ (= 280)\) or \(8 \times 25\ (= 200)\) |
| M1 | complete method to find total frequency for the four intervals eg \(\text{``}3\text{''} + \text{``}5\text{''} + \text{``}14\text{''} + \text{``}10\text{''}\ (= 32)\) or \(\text{``}60\text{''} + \text{``}100\text{''} + \text{``}280\text{''} + \text{``}200\text{''}\ (= 640)\) | |
| C1 | cao |
Additional guidance
Accept equivalent methods proportional to those shown