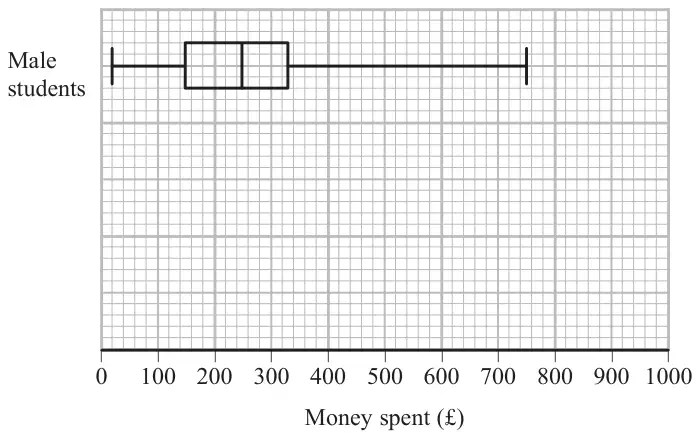
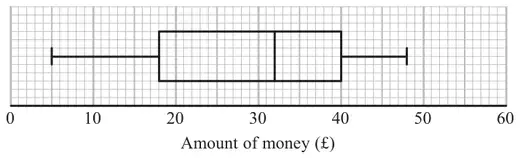
12 The table gives some information about the ages, in years, of 32 actors.
Lowest age
21
Highest age
80
Lower quartile
31
Upper quartile
42
Median
35
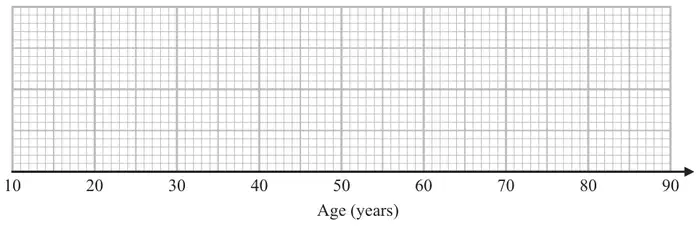
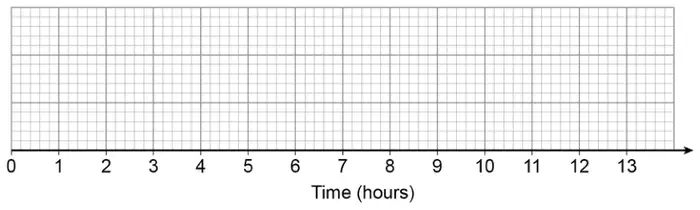
(a) Draw a box plot to represent this information.(3)
(b) Work out an estimate for the number of these actors with an age between 31 years and 42 years. (1)
Mary says,
“At least one of the actors is 35 years old because the median is 35”
(c) Is Mary correct? Give a reason for your answer. (1)
Mark scheme (a)
Answer
Mark
Mark scheme
Drawn
B3
for a fully correct box plot
(B2
for 3 or 4 correctly plotted values including box and whiskers/tails
(B1
for 2 correctly plotted values including box or whiskers/tails or 5 correct values plotted or clearly identified and no box or whiskers/tails)
Additional guidance
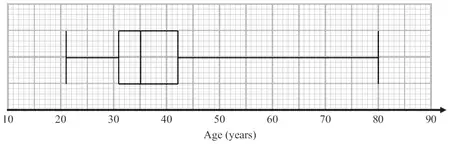
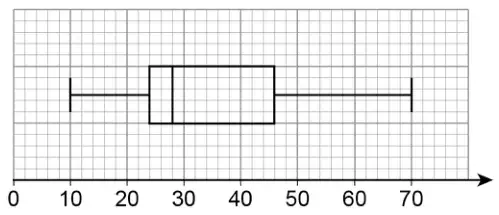
See diagram at end of scheme Min = 21 LQ = 31 Med = 35 UQ = 42 Max = 80
Mark scheme (b)
Answer
Mark
Mark scheme
16
B1
cao
Mark scheme (c)
Answer
Mark
Mark scheme
Explanation
C1
Acceptable examples Not true as the median could be the average of two ages No, the median is not always one of the numbers in the data Because there is an even amount of numbers, there must be 2 in the middle that have a mean of 35 She could be correct if the middle two numbers are both 35
Not acceptable examples Yes… No more are between 31-35 than 35-42 No as there is an even number at least two must be 35 No the median is just the average We can’t tell from the graph Because there is an even amount of numbers Not true as we do not know the exact ages of all data.
Additional guidance
Figures need not be stated, but if they are, they must be correct
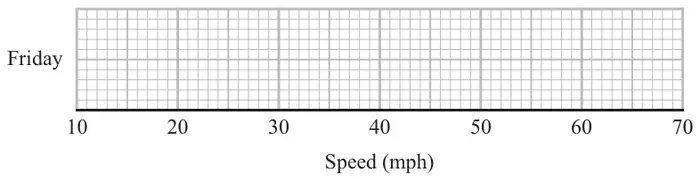
11 Mina records the speeds, in mph, of some cars on a road on Friday. She uses her results to work out the information in this table.
Speed (mph)
Lowest speed
25
Lower quartile
35
Median
40
Interquartile range
12
Range
37
(a) On the grid, draw a box plot to show the information in the table.(3)
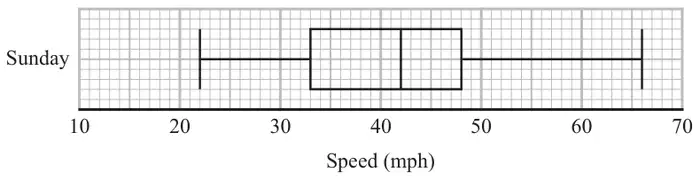
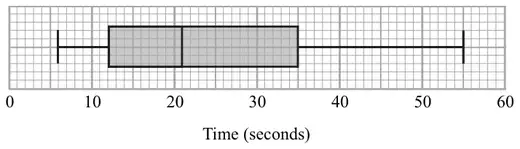
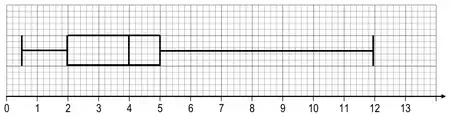
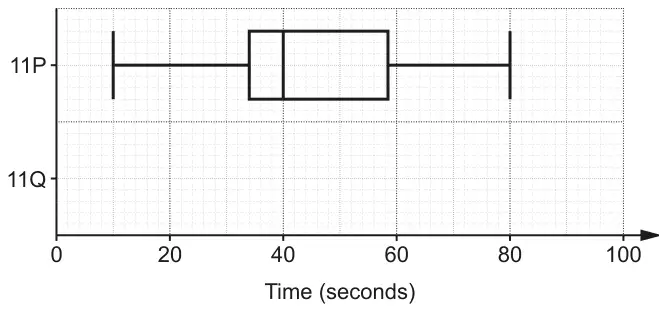
Mina also records the speeds of some cars on the same road on Sunday. She uses her results to draw this box plot.
(b) Compare the distribution of the speeds on Friday with the distribution of the speeds on Sunday. (2)
Mark scheme (a)
Answer
Mark
Mark scheme
Box plot drawn
M1
for method to find UQ (47) or greatest value (62) from the table
M1
for showing a box and at least 3 correctly plotted values from 25, 35, 40, 47, 62
A1
for a fully correct box plot
Additional guidance
May be implied by one of these values being correctly plotted.
Box can be any height. Accept ends that are marked (eg line, cross, dot) or defined by the end of the whiskers if clear
Mark scheme (b)
Answer
Mark
Mark scheme
Comparison
C1
ft a correct comparison of medians from figures, eg the median speed for Sunday was greater than the median speed for Friday or the speed on Friday is generally lower as the median is lower
C1
ft for a correct comparison of spread, eg the (interquartile) range of the speeds for Friday is smaller than the (interquartile) range of the speeds for Sunday, the (interquartile) range on Sunday is larger than the (interquartile) range on Friday Comparisons for this mark can relate to the range or the IQR
Additional guidance
Simply quoting values is insufficient, they must be compared.
Median
Range
IQR
Friday
40
37
12
Sunday
42
44
15
Figures need not be stated but if they are they must be correct.
For 2 marks, at least one comparison must be in context (eg refers to speed or mph)
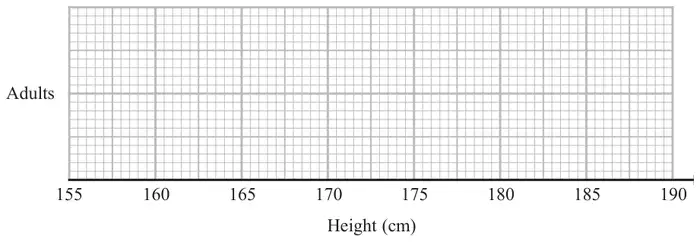
11 The table shows some information about the heights of a group of adults.
least height
169 cm
greatest height
186 cm
median
177 cm
lower quartile
174 cm
upper quartile
180 cm
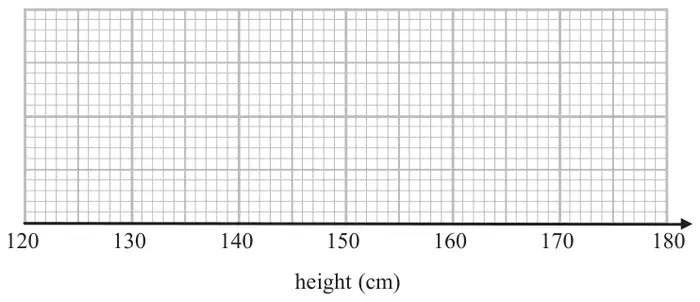
(a) On the grid, draw a box plot for the information in the table.(3)
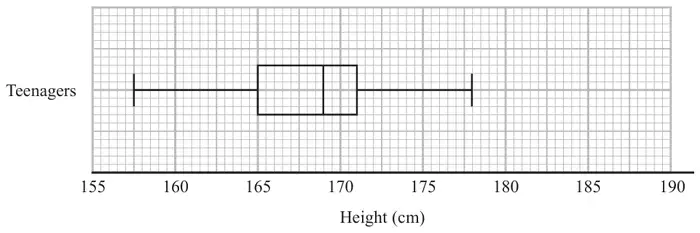
The box plot below shows the distribution of the heights of a group of teenagers.
(b) Compare the distribution of the heights of the adults with the distribution of the heights of the teenagers. (2)
Mark scheme (a)
Answer
Mark
Mark scheme
Box plot
B3
for fully correct box plot
(B2
for box plot showing a box and whiskers and at least 3 correctly plotted values from 169, 174, 177, 180, 186)
(B1
for at least 2 correctly plotted values including a box or whiskers)
Additional guidance
Box can be of any height. Accept ends that are marked (eg line, cross, dot) or defined by the end of the whiskers if clear
Mark scheme (b)
Answer
Mark
Mark scheme
Comparisons
C1
(ft) for a correct comparison of medians, eg the median for Adults is greater than the median for Teenagers or the Teenagers heights are lower in general as the median is lower
C1
(ft) for a correct comparison of a measure of spread, eg the interquartile (range) of the Adults is the same as (similar to) the IQR of the Teenagers, the range of the Teenagers is greater than the range of the Adults Comparisons for this mark can relate to the range or the IQR.
Additional guidance
For 2 marks, at least one comparison must be in context (eg refers to heights or cm).
Simply quoting values for median and range and IQR is insufficient, they must be compared
Median
Range
IQR
Adults
177
17
6
Teenagers
169
20.5
6
Figures need not be seen but if given they must be correct.
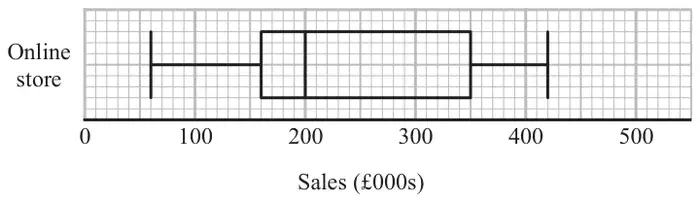
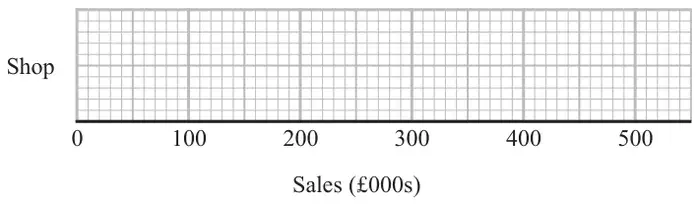
10 The box plot shows information about the sales, in thousands of pounds (£000s), of an online store each month.
Andrew says,
“Three quarters of the given data lies between 160 000 and 350 000 because these are the values of the lower quartile and the upper quartile.”
Andrew is wrong.
(a) Explain why. (1)
The table shows information about the sales, in £000s, in a shop each month.
Sales (£000s)
least value
30
lower quartile
80
median
170
upper quartile
260
greatest value
350
(b) On the grid below, draw a box plot for this information.(2)
(c) Compare the distribution of the sales of the online store with the distribution of the sales in the shop. (2)
Mark scheme (a)
Answer
Mark
Mark scheme
Explanation
C1
for explanation, eg Acceptable examples The IQR is half the data This is half the data \(\frac{3}{4}\) of the data is less than 350(000) \(\frac{3}{4}\) of the data is more than 160(000) \(\frac{3}{4}\) of the data is lies between 60(000) and 350(000) \(\frac{1}{2}\) of the data lies between 160(000) and 350(000)
Not acceptable examples The data lies between 160 and 350 The IQR is 190 (000) IQR = UQ – LQ The upper and lower quartiles represent half the data
Additional guidance
Zeros can be present or missing, but must be consistent.
Mark scheme (b)
Answer
Mark
Mark scheme
box plot drawn
B2
for fully correct box plot
(B1
for showing a box and at least 3 correctly plotted values)
Additional guidance
Box can be of any height. Accept ends that are marked (eg line, cross, dot) or defined by the end of the whiskers if clear
Mark scheme (c)
Answer
Mark
Mark scheme
decision and comparisons
C1
(ft) for correct comparison of medians eg the median for online is greater than the median for the shop, the shop takes less money from sales in general as the median is lower
C1
(ft) for a correct comparison of a measure of spread, eg the interquartile (range) of sales for the online store is greater than the IQR for the sales of the shop Comparisons for this mark can relate to the range or the IQR. For the award of both marks at least one comparison must be in the context of the question.
Additional guidance
Simply quoting values for median, range and IQR is insufficient, they must be compared
Median
Range
IQR
Online
200
360
190
Shop
170
320
180
Also accept figures as 000s as long as consistent. Figures need not be seen but if given they must be correct.
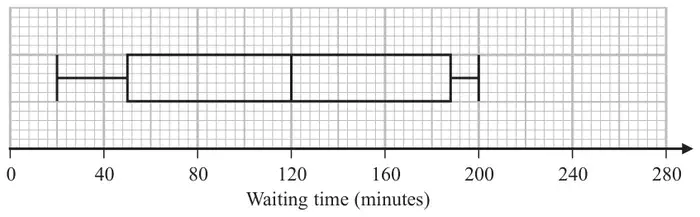
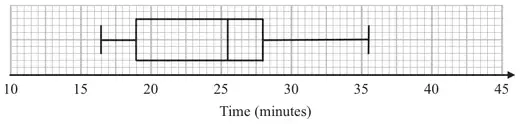
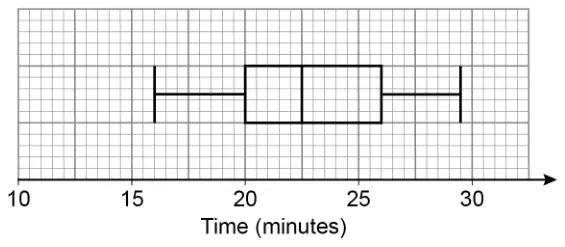
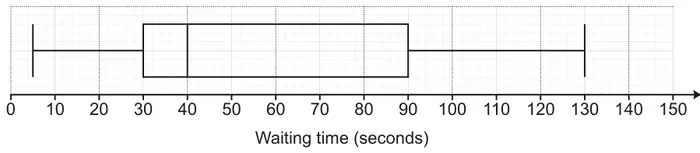
9 The box plot shows information about the length of time, in minutes, some people waited to see a doctor at a hospital on Monday.
(a) Work out the interquartile range of the information in the box plot. (2)
Becky says, “50% of the people waited for at least 2 hours.”
(b) Is Becky correct? Explain why. (1)
The table gives information about the length of time, in minutes, some people waited to see a doctor at the same hospital on Tuesday.
Waiting time (minutes)
Shortest time
20
Lower quartile
50
Median
100
Upper quartile
140
Longest time
210
Becky was asked to compare the distribution of the lengths of times people waited on Monday with the distribution of the lengths of times people waited on Tuesday.
She wrote, “People had to wait longer on Tuesday than on Monday.”
(c) Give one reason why Becky may be wrong. (1)
Mark scheme (a)
Answer
Mark
Mark scheme
138
M1
for upper quartile = 188 or lower quartile = 50 or an indication that they are trying UQ – LQ
A1
cao
Additional guidance
Could be written on the grid
Mark scheme (b)
Answer
Mark
Mark scheme
Yes, with reason
C1
Yes, with reason Acceptable examples Yes, because the median is at 2 hour (120 min) Yes, since 50% is at the 2 hour mark Yes, because the middle is at 2 hours
Not acceptable examples No ….. The median is at the 2 hour mark Yes, because 50% is exactly half way between “188” and “50”
Mark scheme (c)
Answer
Mark
Mark scheme
statement
C1
Acceptable examples The median is lower on Tuesday (higher on Monday) The upper quartile is lower on Tuesday (higher on Monday) There may just have been one person waiting for 210 mins We don’t know how many people were waiting for each time
Not acceptable examples The range is bigger for Tuesday (smaller for Monday) The IQR is smaller for Tuesday (bigger for Monday)
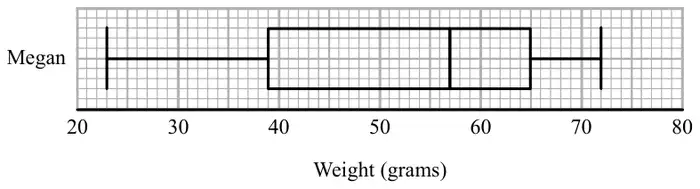
The box plot below shows information about the weights of Megan’s potatoes.
Megan says that half of her potatoes weigh less than 50 grams each.
(a) Is Megan correct? Give a reason for your answer. (1)
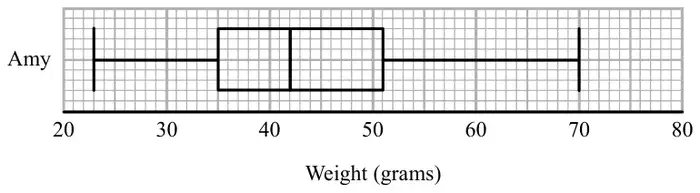
Amy also grows potatoes.
The box plot below shows information about the weights of Amy’s potatoes.
(b) Compare the distribution of the weights of Megan’s potatoes with the distribution of the weights of Amy’s potatoes. (2)
Mark scheme (a)
Answer
Mark
Mark scheme
Explanation
C1
eg ‘No’ the median is 57
Mark scheme (b)
Answer
Mark
Mark scheme
Comparison
C1
(ft) a correct comparison of medians eg the median weight for Megan was greater than the median weight for Amy
C1
a correct comparison of a measure of spread eg the interquartile range of weights for Megan was greater than the interquartile range of weights for Amy For the award of both marks at least one of the comparisons must be in the context of the question
Additional guidance
Simply quoting values for median, range and IQR is insufficient, they must be compared
Median
Range
IQR
Megan
57
49
26
Amy
42
47
16
Figures given must be correct. Comparisons can relate to the range or the IQR
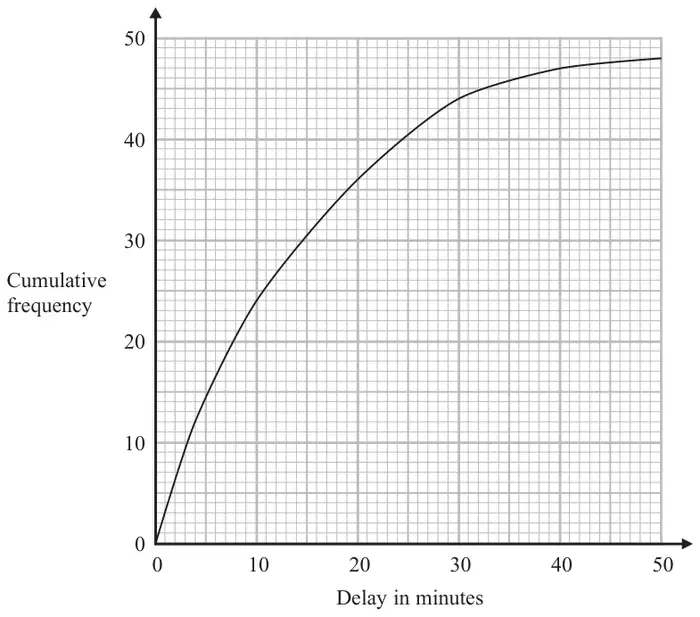
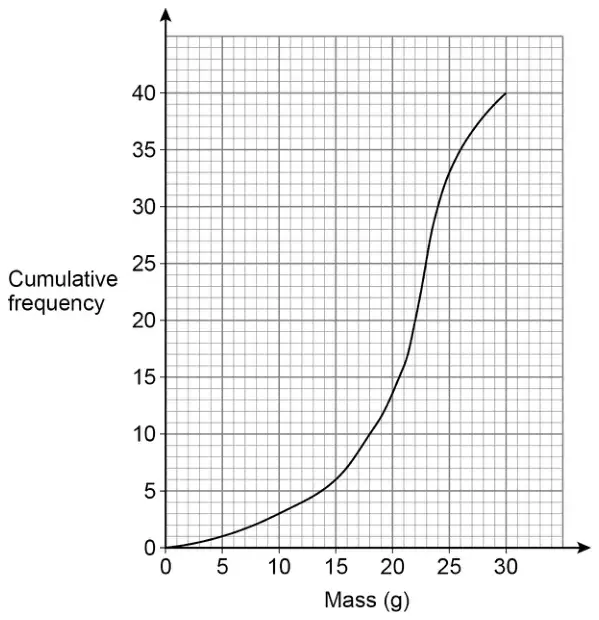
9 The times that 48 trains left a station on Monday were recorded.
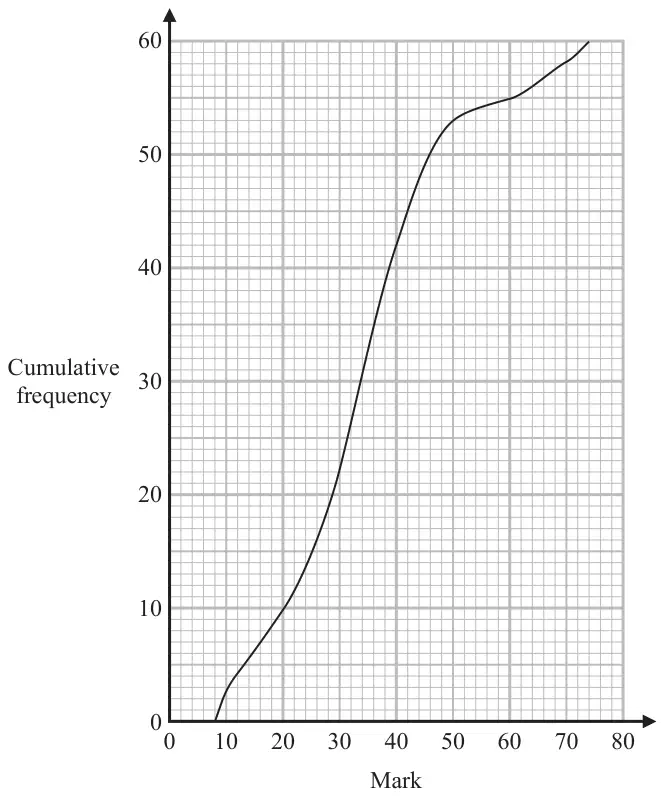
The cumulative frequency graph gives information about the numbers of minutes the trains were delayed, correct to the nearest minute.
The shortest delay was 0 minutes. The longest delay was 42 minutes.
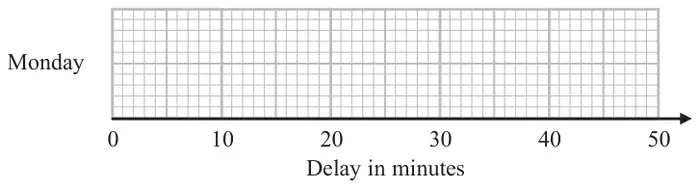
(a) On the grid below, draw a box plot for the information about the delays on Monday.(3)
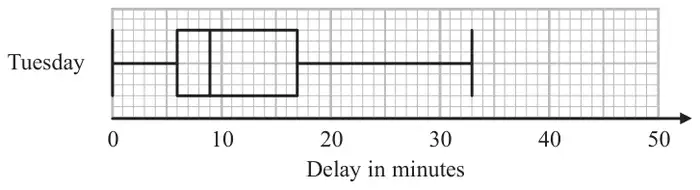
48 trains left the station on Tuesday. The box plot below gives information about the delays on Tuesday.
(b) Compare the distribution of the delays on Monday with the distribution of the delays on Tuesday. (2)
Mary says,
“The longest delay on Tuesday was 33 minutes. This means that there must be some delays of between 25 minutes and 30 minutes.”
(c) Is Mary right? You must give a reason for your answer. (1)
Mark scheme (a)
Answer
Mark
Mark scheme
box plot drawn
B1
ends of whiskers at 0 and 42 with a box
B1
median at 10 inside a box
B1
for ends of box at 4 and 20
Additional guidance
The box can be of any height. Accept ends that are marked (eg line, cross, dot) or defined by the end of the whiskers if clear.
Has to be inside a box; whiskers not required
An independent mark that can be awarded for just a box; do not need whiskers for this mark.
Mark scheme (b)
Answer
Mark
Mark scheme
Comparison
C1
for a correct comparison of medians, eg. the median delay time on Mon was greater than the median delay time on Tues. or ft (a)
C1
for a correct comparison of a measure of spread, eg. the interquartile range (range) of delay times on Mon was greater than the interquartile range (range) of delay times on Tues. or ft (a) For the award of both marks at least one of the comparisons must be in context
Additional guidance
Simply quoting values for median, range and IQR is insufficient, they must be compared
Comparisons can relate to the median, and then either the range or the IQR.
Mark scheme (c)
Answer
Mark
Mark scheme
statement
C1
‘No’ with statement explaining that there might not be any delays between 25 minutes and 30 minutes as in the upper 25% (12 trains) the delays may all be between 17 and 25 or 30 and 33
Additional guidance
The ‘No’ may be implied from their wording, and could be written next to the “?” The statement must mention (or imply) values above the UQ of 17
10 The table gives some information about the heights of 80 girls.
Least height
133 cm
Greatest height
170 cm
Lower quartile
145 cm
Upper quartile
157 cm
Median
151 cm
(a) Draw a box plot to represent this information.(3)
(b) Work out an estimate for the number of these girls with a height between 133 cm and 157 cm. (2)
Mark scheme (a)
Answer
Mark
Mark scheme
Box plot drawn
B3
for a fully correct box plot
(B2
for at least 3 correctly plotted values including box and whiskers/tails )
(B1
for at least 2 correctly plotted values including box or whiskers/tails or 5 correct values plotted or clearly identified and no box or whiskers/tails )
Additional guidance
Condone the lack of a vertical marker at the end of the tails
Note that a box must be present, as must “tails”
Mark scheme (b)
Answer
Mark
Mark scheme
60
M1
for a method to find ¾ of 80 eg \(20 + 20 + 20\) or \(\frac{3}{4} \times 80\)
12 The table shows information about the heights, in cm, of a group of Year 11 girls.
height (cm)
least height
154
median
165
lower quartile
161
interquartile range
7
range
20
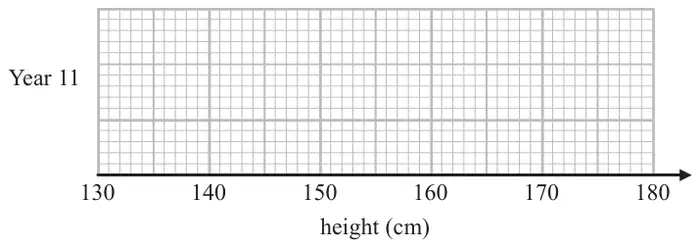
(a) Draw a box plot for this information.(3)
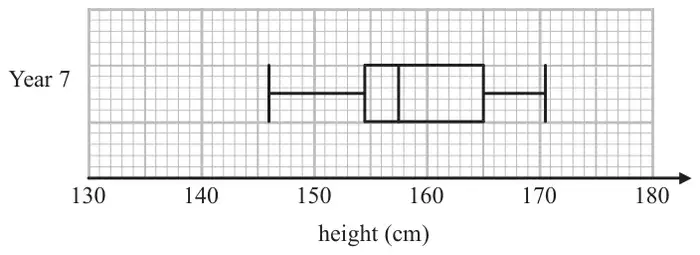
The box plot below shows information about the heights, in cm, of a group of Year 7 girls.
(b) Compare the distribution of heights of the Year 7 girls with the distribution of heights of the Year 11 girls. (2)
Mark scheme (a)
Working
Answer
Mark
Notes
\(161 + 7\) \(154 + 20\)
Box plot
M1
for method to find UQ (168) or highest value (174), may be implied by correct values plotted
M1
for showing a box and at least 3 correctly plotted values from 154, 161, 165, 168, 174
A1
for fully correct box plot
Mark scheme (b)
Working
Answer
Mark
Notes
Med IQR Range Y11 165 7 20 Y7 157.5 10.5 24.5
Comparison
C1
(ft) for comparison of the median
C1
(ft) for comparison of the spread NB: for award of both marks, at least one comparison must be in context. NB: figures need not be stated, but if they are they must be correct (ft)
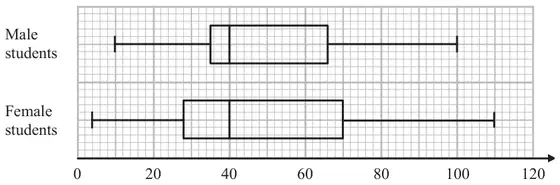
*19 Some students were asked how many times they each used their mobile phones last week.
The box plots give information about the male students’ answers and about the female students’ answers.
Compare the two distributions represented by the box plots. (3)
Mark scheme
Working
Answer
Mark
Notes
M
F
Median
40
40
Range
90
106
IQR
31
42
Compare: medians and spread
3
C1 for any correct comparison of the medians C1 for any correct comparison of the IQRs or range C1 for a comparison of medians, IQRs or ranges written in context
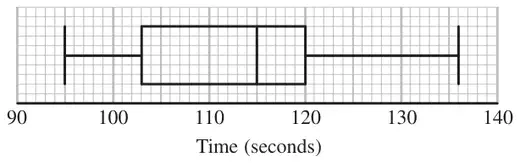
Compare the distribution of the times for the boys with the distribution of the times for the girls. (4)
Mark scheme
Working
Answer
Mark
Notes
Boys
Girls
Median:
115
112
Range:
41
33
IQR:
17
9
Comparison of data
4
B1 for correct median for girls or boys B1 for any correct range or IQR C1 for a correct comparison of the medians C1 ft for a correct comparison of the ranges or IQRs For the award of both C marks at least one of the comparisons made must be in the context of the question and all figures used for comparisons correct.
OR
B2 for an accurately drawn boxplot ( superimposed) C1 for a correct comparison of the medians C1 for a correct comparison of the ranges or IQRs For the award of both C marks at least one of the comparisons made must be in the context of the question
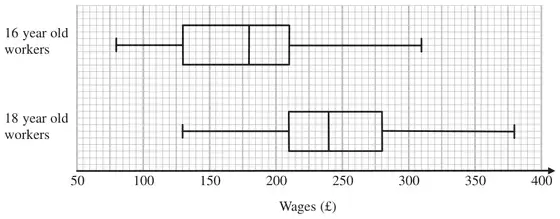
15 The box plots give information about the wages of a group of 16 year old workers and a group of 18 year old workers.
*(a) Compare the distribution of the wages of the 16 year old workers with the distribution of the wages of the 18 year old workers. (3)
There are 200 workers who are 16 years old.
(b) Work out an estimate for the number of these workers whose wages are £130 or more. (2)
Mark scheme (a)
Working
Answer
Mark
Notes
Age 16
Age 18
HV
310
<
380
LV
80
<
130
Median
180
<
240
Range
230
<
250
IQR
80
>
70
Compares: medians and spread
3
C1 for any correct comparison of the medians C1 for any correct comparison of the IQRs or the ranges C1 (dep on one C1) for either statement written in context
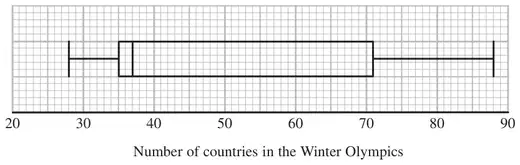
18 The box plot shows information about the number of countries competing in each Winter Olympic Games since 1948
(a) Write down the median. (1)
(b) Work out the interquartile range. (2)
The table below shows information about the number of countries competing in each Summer Olympic Games since 1948
Smallest
Lower quartile
Median
Upper quartile
Largest
Number of countries
59
83
121
199
204
*(c) Compare the two distributions. (2)
Mark scheme (a)
Answer
Mark
Notes
37
1
B1 cao
Mark scheme (b)
Answer
Mark
Notes
36
2
M1 for identifying LQ and UQ e.g 35 – 71 A1 cao
Mark scheme (c)
Answer
Mark
Notes
2
C1 for a correct comparison of medians ft (a) C1 for a correct comparison of a measure of spread with correct figures ft (b) For the award of both marks at least one of the comparisons must be interpretative
18 The owners of a car park recorded the number of cars parked at 12 noon each day.
The table shows information about the number of cars parked in the car park at 12 noon each day in July and in December.
July
December
Least number of cars
75
100
Lower quartile
90
115
Median
95
130
Upper quartile
150
150
Greatest number of cars
178
180
(a) What type of diagram could you draw to represent the information for each month? (1)
*(b) Compare the distribution of the number of cars recorded in July with the distribution of the number of cars recorded in December. (2)
Mark scheme (a)
Answer
Mark
Notes
Diagram type
1
B1 for box plot or box and whisker or cumulative frequency
Mark scheme (b)
Answer
Mark
Notes
Comparison given
2
C1 for a correct comparison of medians C1 for a correct comparison of a measure of spread with correct figures NB for the award of both marks at least one of the comparisons must be in context
15 The students in a class kept a record of the amount of time, in minutes, they spent doing homework last week.
The table shows information about the amount of time the girls spent doing homework last week.
Minutes
Least amount of time
60
Range
230
Median
170
Lower quartile
100
Upper quartile
220
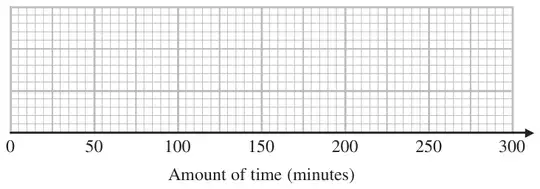
(a) On the grid, draw a box plot for the information in the table.(2)
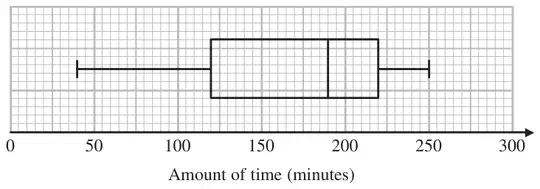
The box plot below shows information about the amount of time the boys spent doing homework last week.
*(b) Compare the amount of time the girls spent doing homework with the amount of time the boys spent doing homework. (2)
Mark scheme (a)
Answer
Mark
Notes
correct box plot
2
M1 for a box drawn with at least 2 correct points from LQ, Median and UQ or with maximum value of 290 plotted A1 for a fully correct box plot
Mark scheme (b)
Working
Answer
Mark
Notes
girls
boys
Med
170
190
Range
230
210
IQR
120
100
2 comparisons
2
C1 for a correct comparison of a measure of spread (using either range or IQR) or ft their box plot C1 for a correct comparison of medians (accept averages) For the award of both marks at least one of these comparisons must be in the context of the question.
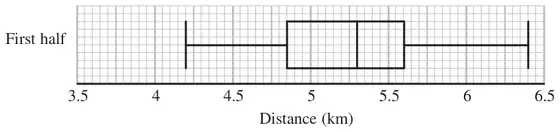
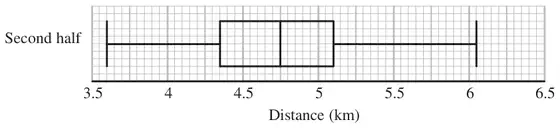
16 Colin took a sample of 80 football players. He recorded the total distance, in kilometres, each player ran in the first half of their matches on Saturday.
Colin drew this box plot for his results.
(a) Work out the interquartile range. (2)
There were 80 players in Colin’s sample.
(b) Work out the number of players who ran a distance of more than 5.6 km. (2)
Colin also recorded the total distance each player ran in the second half of their matches. He drew the box plot below for this information.
(c) Compare the distribution of the distances run in the first half with the distribution of the distances run in the second half. (2)
Mark scheme (a)
Answer
Mark
Notes
0.75
2
M1 for \(\text{``}5.6\text{''} - \text{``}4.85\text{''}\) with at least one value correct A1 cao
Mark scheme (b)
Answer
Mark
Notes
20
2
M1 for a complete method e.g. \(80 \div 4\) A1 cao
Mark scheme (c)
Answer
Mark
Notes
2 comparisons
2
B1 ft from (a) for a correct comparison of a measure of spread B1 for a correct comparison of medians (accept averages) For the award of both marks at least one of the comparisons made must be in the context of the question.
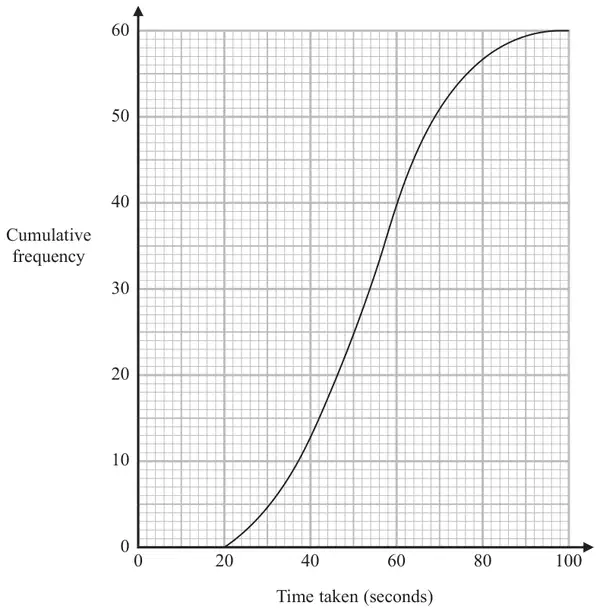
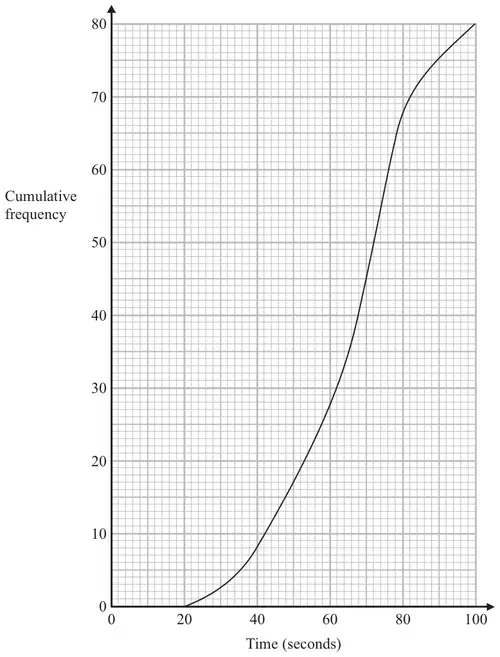
18 The cumulative frequency graph shows information about the times 80 swimmers take to swim 50 metres.
(a) Use the graph to find an estimate for the median time. (1)
A swimmer has to swim 50 metres in 60 seconds or less to qualify for the swimming team.
The team captain says,
“More than 25% of swimmers have qualified for the swimming team.”
*(b) Is the team captain right? You must show how you got your answer. (3)
For these 80 swimmers the least time taken was 28 seconds and the greatest time taken was 96 seconds.
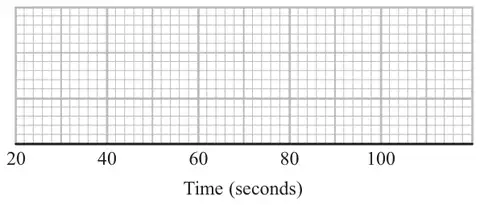
(c) Use the cumulative frequency graph and the information above to draw a box plot for the times taken by the swimmers.(3)
Mark scheme (a)
Answer
Mark
Notes
68
1
B1 cao
Mark scheme (b)
Answer
Mark
Notes
Yes as \(28 \gt 20\) or \(35\% \gt 25\%\) or \(53 \lt 60\)
3
M1 for reading a value from graph at time = 60 (=28, accept 27 to 28) M1 for ‘28’ \(\div 80 \times 100\) (= 35) or \(25 \div 100 \times 80\) (= 20) C1 (dep on M2) for correct decision based on their figures
OR
M1 for \(25 \div 100 \times 80\) (= 20) M1 for reading a value from graph at cf = 20 (=53, accept 52 to 54) C1 (dep on M2) for correct decision based on their figures
Mark scheme (c)
Working
Answer
Mark
Notes
28, 53, 68, 76, 96
Box plot plotted
3
B1 for ends of whiskers at 28 and 96 with a box B1 ft for median at ‘68’ inside a box B1 for ends of box at 53 (accept 52 to 54) and 76
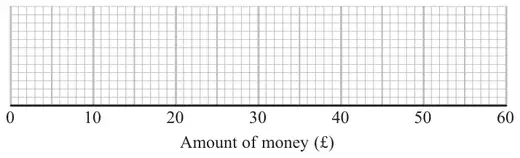
17 Some girls did a sponsored swim to raise money for charity.
The table shows information about the amounts of money (£) the girls raised.
Least amount of money (£)
10
Greatest amount of money (£)
45
Median
25
Lower quartile
16
Upper quartile
42
(a) On the grid, draw a box plot for the information in the table.(2)
Some boys also did the sponsored swim. The box plot shows information about the amounts of money (£) the boys raised.
(b) Compare the amounts of money the girls raised with the amounts of money the boys raised. (2)
Mark scheme (a)
Answer
Mark
Notes
Box plot overlay
2
M1 for a box drawn with at least 2 correct points from LQ, Med and UQ A1 for a fully correct box plot
Mark scheme (b)
Answer
Mark
Notes
Comparison of a measure of spread plus a comparison of medians (in context)
2
B1 for a correct comparison of a measure of spread (using either range or iqr) B1 for a correct comparison of medians For the award of both marks at least one of the comparisons made must be in the context of the question.
18 Here are the times, in seconds, that 15 people waited to be served at Rose’s garden centre.
5 9 11 14 15 20 22 25 27 27 28 30 32 35 44
(a) On the grid, draw a box plot for this information.(3)
The box plot below shows the distribution of the times that people waited to be served at Green’s garden centre.
(b) Compare the distribution of the times that people waited at Rose’s garden centre and the distribution of the times that people waited at Green’s garden centre. (2)
Mark scheme (a)
Working
Answer
Mark
Notes
minimum = 5 lower quartile = 14 median = 25 upper quartile = 30 maximum = 44
box plot
3
B3 for fully correct box plot (B2 for at least 3 correct values plotted including box and tails or 5 correct values indicated) (B1 for at least 2 correct values plotted including box or tails or 3 or 4 correct values indicated)
Mark scheme (b)
Answer
Mark
Notes
comparisons
2
B1 for a correct comparison (ft) of medians B1 for a correct comparison (ft) of ranges or IQRs
19 Sameena recorded the times, in minutes, some girls took to do a jigsaw puzzle.
Sameena used her results to work out the information in this table.
Minutes
Shortest time
18
Lower quartile
25
Median
29
Upper quartile
33
Longest time
44
(a) On the grid, draw a box plot to show the information in the table.(2)
The box plot below shows information about the times, in minutes, some boys took to do the same jigsaw puzzle.
(b) Compare the distributions of the girls’ times and the boys’ times. (2)
Mark scheme (a)
Answer
Mark
Notes
Box plot
2
B2 cao (B1 for ends of whiskers at 18 and 44 (as part of a box plot diagram) OR for ends of box at 25 and 33 with median at 29)
Mark scheme (b)
Answer
Mark
Notes
2 comparisons
2
B2 ft for two comparisons with at least one referring to IQR or median values (B1 ft for one comparison of IQRs, medians, or other values) As well as median or interquartile range accept other valid references to spread if explained correctly within a statistical context. Statements need to be true.
This year he put his tomato plants into two groups, group A and group B.
Harry gave fertiliser to the tomato plants in group A. He did not give fertiliser to the tomato plants in group B.
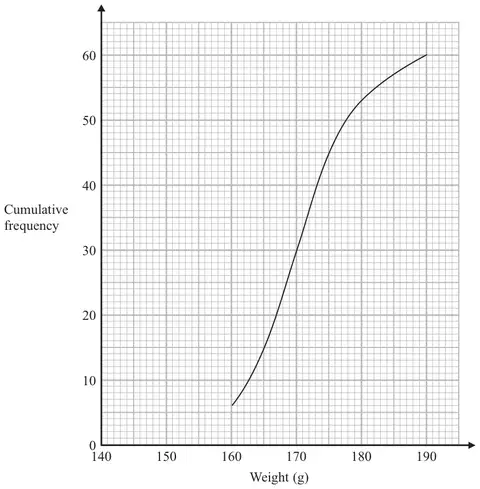
Harry weighed 60 tomatoes from group A. The cumulative frequency graph shows some information about these weights.
(a) Use the graph to find an estimate for the median weight. (1)
The 60 tomatoes from group A had a minimum weight of 153 grams and a maximum weight of 186 grams.
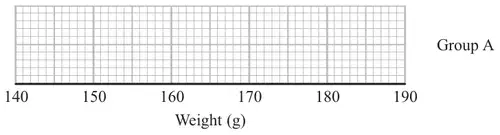
(b) Use this information and the cumulative frequency graph to draw a box plot for the 60 tomatoes from group A.(3)
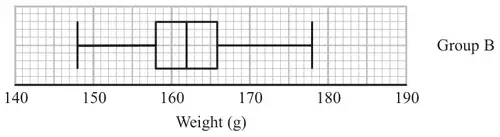
Harry did not give fertiliser to the tomato plants in group B. Harry weighed 60 tomatoes from group B. He drew this box plot for his results.
(c) Compare the distribution of the weights of the tomatoes from group A with the distribution of the weights of the tomatoes from group B. (2)
Mark scheme (a)
Answer
Mark
Notes
170
1
B1 accept answers in range 170 - 170.5 inclusive
Mark scheme (b)
Answer
Mark
Notes
3
B3 for box plot with all 3 aspects correct (overlay) aspect 1 : ends of whiskers at 153 and 186 aspect 2 : ends of box at 165 and 175 aspect 3 : median marked at 170 or ft (a) provided \(165 \lt\) (a) \(\lt 175\) (B2 for box plot with two aspects correct) (B1 for one aspect or correct quartiles and median identified) SC : B2 for all 5 values (153, 165, ‘170’, 175, 186) plotted
Mark scheme (c)
Answer
Mark
Notes
Two correct comparisons
2
B1 ft from (b) for a correct comparison of range or inter-quartile range eg. the range / iqr is smaller for group B than group A B1 ft from (b) for a correct comparison of median or upper quartile or lower quartile or minimum or maximum eg. the median in group A is greater than the median in group B
16 Here is some information about the lengths, in cm, of leaves.
Shortest length \(= 2.4\)
Longest length \(= 9\)
Upper quartile \(= 7\)
Median length \(= 6\)
Interquartile range \(= 3\)
Draw a box plot to show this information. [3 marks]
Mark scheme
Answer
Mark
Comments
Fully correct box plot with shortest at 2.4 cm LQ at 4 cm median at 6 cm UQ at 7 cm longest at 9 cm
B3
mark intention B2 box plot with four correct plots and one incorrect/omitted plot or box plot with five correct plots and at most one extra plot B1 at least three correct plots
Additional guidance
A box plot must be a rectangle with ‘whiskers’
Accept ‘whiskers’ ending in points rather than vertical lines
For B2 condone the median given as a point in the rectangle
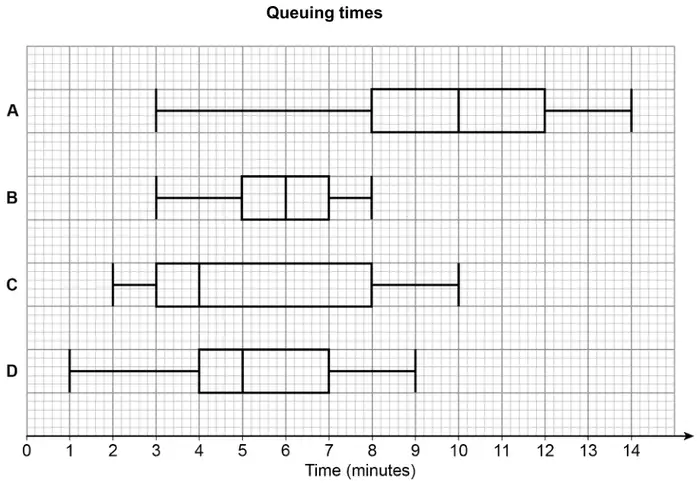
15 In a survey, queuing times at supermarket checkouts were recorded.
One morning, samples of 50 customers were taken at supermarkets A, B, C and D.
The box plots represent the results.
(a) On average, which supermarket had the lowest queuing times?
Give a reason for your answer. [2 marks]
(b) At which supermarket were the queuing times most consistent?
Give a reason for your answer. [2 marks]
Mark scheme (a)
Answer
Mark
Comments
C and ‘lowest median’
B2
oe B1 C
Additional guidance
If the value of the median is given it must be 4 for B2
Accept midpoint oe for median
Do not accept mean for median
Only accept average for median if the value of 4 is also given
Accept mention of the lowest lower quartile with correct mention of the median for B2, but do not accept mention of any extra statistical measure as part of their justification
Mark scheme (b)
Answer
Mark
Comments
B and ‘lowest interquartile range’ or B and ‘lowest range’
B2
oe B1 B
Additional guidance
If the value of the interquartile range is given it must be 2 for B2 If the value of the range is given it must be 5 for B2
For B2, do not accept non-statistical reasons, eg ‘the narrowest box’
For B2, do not accept mention of any extra statistical measure as part of their justification
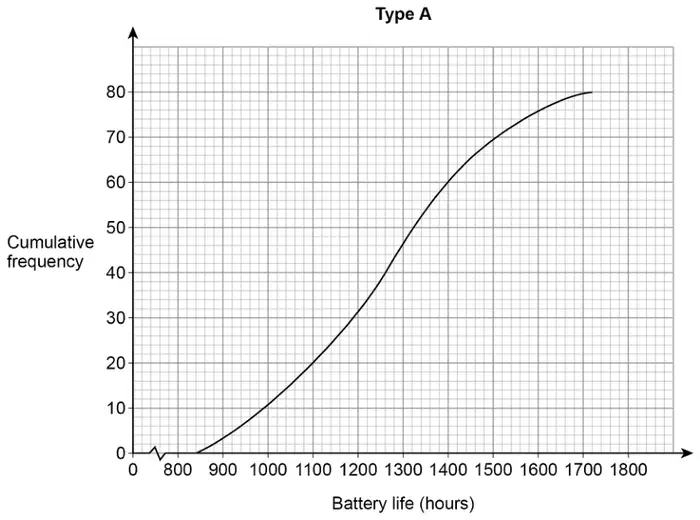
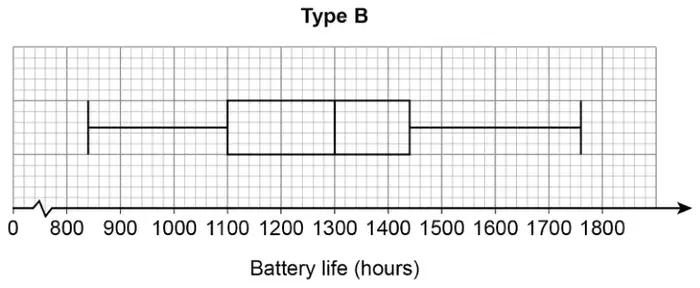
19 Type A batteries and type B batteries were tested.
The cumulative frequency diagram shows information about the battery life of type A.
(a) Estimate the interquartile range for type A. [2 marks]
(b) Estimate the number of type A batteries that had a battery life of more than 1600 hours. [1 mark]
(c) The box plot shows information about the battery life of type B.
On average, which type had the greater battery life?
Tick a box.
type A
type B
Using data from both diagrams, state how you chose your answer. [2 marks]
Mark scheme (a)
Answer
Mark
Comments
300
B2
B1 1100 or 1400 seen
Mark scheme (b)
Answer
Mark
Comments
4
B1
Additional guidance
Ignore incorrect ‘units’ eg 4 people
B1
Mark scheme (c)
Answer
Mark
Comments
Ticks type B and gives valid reason
B2
eg valid reasons (median for A is) 1260 and (median for B is) 1300 median for B is 40 more (than A)
B1 no or incorrect decision and (median for A is) 1260 and (median for B is) 1300 or no or incorrect decision and median for B is 40 more (than A) or ticks type B and (median for B is) 1300 and (median for A is) 1230 or 1280 or ticks type B and B has a larger median (than A) (if one median given it must be correct)
Additional guidance
If median values are not given in the wording, look for values on the graph and box plot
Ticks type B but gives no valid reason
B0
Allow use of average or middle for median, or a correct description eg ‘top 50%’. Do not accept ‘mean’ or ‘mode’ or other statistical measures for median
Ignore comments about measures other than the median
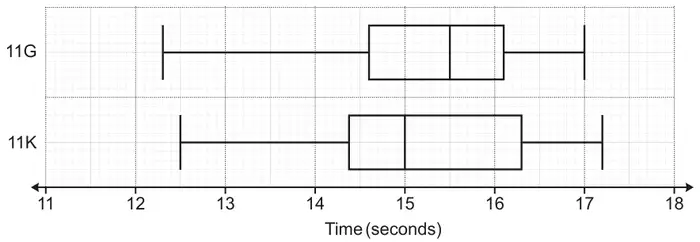
17 Two Year 11 classes, 11G and 11K, record their times for a race. The box plots show the distribution of the times, in seconds, for each class.
(a) Write down the percentage of students in 11G who took longer than 14.6 seconds. [1]
(b) Which class, 11G or 11K, was fastest on average? Include values to support your decision. [2]
Mark scheme (a)
Answer
Marks
Part marks and guidance
75
1
Mark scheme (b)
Answer
Marks
Part marks and guidance
11K and medians 15 and 15.5
2
B1 for 11K with decision clearly supported by an attempted use of medians or for both medians correct
See Appendix For 2 marks, accept “average” and condone “mean” for median For 1 mark, use of “average/mean” must also have one correct median value
Credit median values written on diagram only if referenced in their reason
For 2 marks and B1, ignore mention of min/max/quartiles/IQR/range with correct or no values, as long as not an incorrect interpretation. If the interpretation is incorrect, or incorrect values are given, award 0 marks.
Appendix: Question 17b
Response
Mark
11K the midpoint of the time they finished the race is 15 secs whereas for the other it is 15.5 seconds
2 condone midpoint for median
11K 50% of the class were faster than 15 seconds whereas in 11G 50% were faster than 15.5 seconds
2 implies use of median
11K the median is lower AND only 15 and 15.5 written on diagram
2
11K because their median was 0.5 less than 11G
1 median values need to be seen for 2
11K because the median time of 15 was quicker
1 one correct median
11K medians are 14.9 and 15.5
1 one correct median
11K averages are 14.9 and 15.5
1 one correct median value so intent that “average” is median
11K the median is lower
1 intent to use median
11K the median is lower (with lots of values written on diagram)
1 intent to use median, choice of values
11G the median is higher AND 15 and 15.5 written on diagram
1 wrong conclusion, intent to use median and correct values
11G averages are 15 and 15.5
1 wrong conclusion, condone “average” for median, both correct values
11K has a bigger IQR and a lower median
1bod IQR not relevant but true
11K (15 and 15.5 stated but not called median/average/mean)
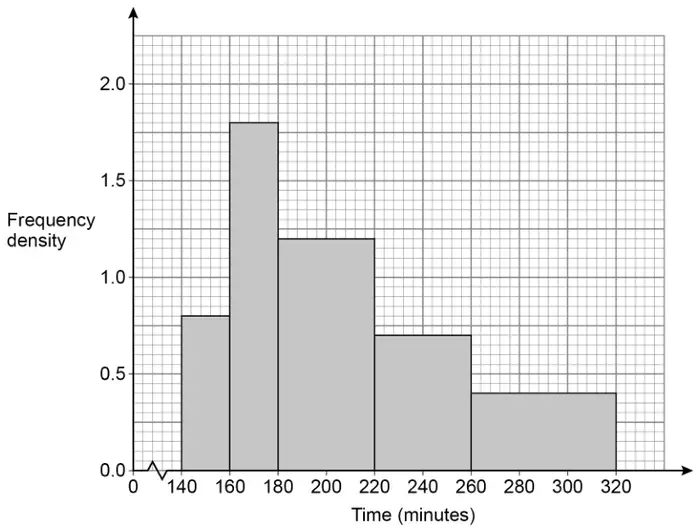
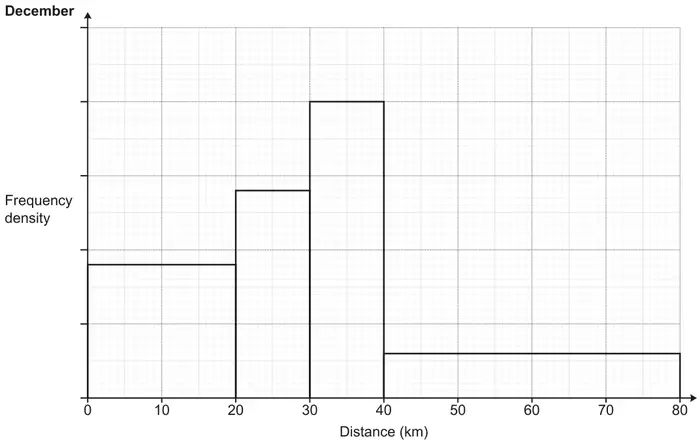
13 A running club records the distances run by each member during December. The results are shown in this histogram.
(a) 18 members run less than 20 km.
(i) Work out the number of members who run more than 30 km. [3]
(ii) Finley says
To estimate the range, I subtracted the smallest possible value from the largest possible value. So, 80 – 0 = 80 km.
Explain why Finley’s method is likely to overestimate the true value of the range. [1]
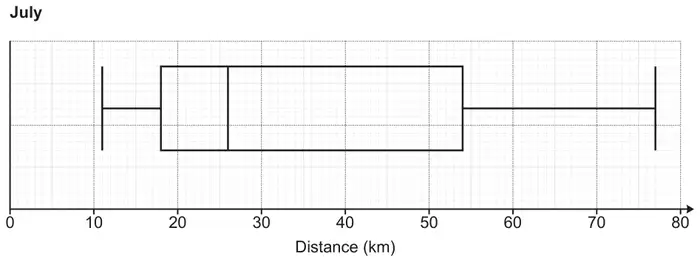
(b) This box plot shows the distribution of the distance run by each member of the running club during July.
During December,
the median distance run was 30 km
the interquartile range of the distance run was 20 km.
Make two comparisons between the distances run during December and the distances run during July. Include values to support your comparisons. [4]
Mark scheme (a)
Answer
Marks
Part marks and guidance
(a)(i)
32
3
M1 for 18 ÷ 20 soi by 0.9
M1 for \(2k \times 10\) [+] \(0.3k \times 40\) implied by 20 and 12 may be on diagram
May be soi on the vertical axis (eg. labelling the scale with [0.5,]1, [1.5, 2].
Where \(k\) is a consistent scaling of the height of the bars eg 4 × 10 [+] 0.6 × 40, 40 × 10 [+] 6 × 40 etc
Ignore extras
(a)(ii)
Unlikely the largest value will be 80 oe or The longest distance could be anywhere between 40 and 80 oe or Unlikely the smallest value will be 0 oe or The shortest distance could be anywhere between 0 and 20 oe
1
Accept: Exact distances are not known The data is in groups
Mark scheme (b)
Answer
Marks
Part marks and guidance
Median for July = 26
1
Condone mean or average for July = 26
If 0 scored overall SC1 for two correct comparisons lacking values
See appendix Condone not repeating the given values for December Need figures in comment/work space Comparison comment must be general and have context for second and fourth marks Accept for first mark “median is 4 more in Dec” oe Accept for third mark “IQR is 16 less in Dec” oe
eg SC1 for “median for July was lower” and “IQR for July was higher” oe
July distances were lower [on average] oe
1dep
IQR for July = 36
1
July distances were more varied oe
1dep
Appendix: Question 13b
Response
Comment
Marks
The median in Dec is 30 compared to July 26. This means on average people ran further in December. The IQR in Dec is 20 compared to July 36. This means the distances run were more variable in July.
Value. Compare the meaning of “on average” with “average” in the ninth example. We want a general interpretation in context. Value. Interpretation in context.
1 1 1 1
The median in Dec is 30 compared to July 26. This means the distances run in December were greater. The IQR in Dec is 20 compared to July 36. More people tended to run similar distances in December.
Value. A general interpretation in context. Value. Interpretation in context.
1 1 1 1
In July the runners on average ran shorter distances at 26km, while in December they ran further at 30km. In July the runners had a much larger IQR of distances at 36km, while in December they had a smaller IQR.
Value. Comparison in context. “on average” is a general comparison, which is what is looked for. Value. IQR not interpreted as a measure of variation.
1 1 1 0
December has a higher median distance run (26km < 30km). December has a smaller IQR compared to July (20km < 36km). This means December has a smaller spread of distances compared to July.
Value. Not an interpretation. Value. Interpretation in context.
1 0 1 1
The mean in July is 26. The range in July is 36.
Condone mean for value mark. Condone range for value mark.
1 0 1 0
The mean in July is 26. The IQR in July is 36. This means there is a bigger range of distances in July.
Condone mean for value mark. Not accepting “range” in the interpretation as it also has a technical meaning.
1 0 1 0
The median distance run in July was 26 compared to 30 in December The IQR in July is 36 compared to 20 in December
Value. Not an interpretation. Value. Not an interpretation.
1 0 1 0
The median distance in December was 4km more than in July. The IQR is 16km higher in July than in December.
Implies July is 26km. Not an interpretation. Implies July is 36km. Not an interpretation.
1 0 1 0
The median distance run in Dec is 30km compared to July 26km. This means their average is more than July. The IQR for December is less than July so it’s more consistent.
Value. ”average” being used as another word for “median” rather than as a general descriptor. No value. No context; dependent on the previous mark in any case.
1 0 0 0
There was a higher average of km in December. More spread out results in July.
No values. Comparison marks are dependent on value marks. However, they have two correct comparisons lacking values and context.
SC1
December had a higher median meaning people were running further. July had a larger average compared to December.
No value. Correct comparison in context but mark is dependent on value mark. The second statement contradicts the first and is not about IQR. Therefore, SC1 cannot be awarded.
0 0 0 0
The distance run in July was more than the distance run in December. More people run further in July than December.
No value. Incorrect and dependent on value in any case. Not about IQR.
17 Charlie weighs many apples. The weights of the apples are summarised below.
heaviest apple = 75 g
range = 50 g
median = 60 g
lower quartile = 45 g
50% of the apples weigh between 45 g and 65 g
mean = 63 g
(a)
(i) Write down the interquartile range for the weights of the apples, in g. [1]
(ii) Write down the percentage of the apples that weigh between 45 g and 60 g. [1]
(b) Draw a box plot to show the distribution of the weights of the apples.[3]
(c) Charlie eats two of the apples. The apples that they eat weigh 58 g and 66 g.
Charlie says
The mean weight of all the apples was 63 g. I ate one apple that weighed less than the mean and another apple that weighed more than the mean. Therefore, the mean of the remaining apples will still be 63 g.
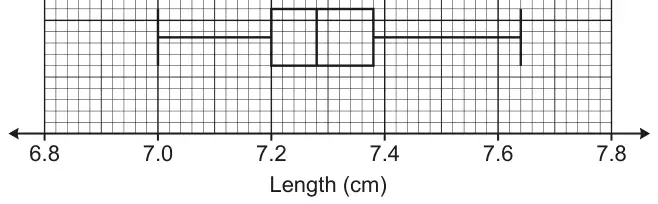
12 The box plot shows the distribution of the lengths, in cm, of 60 full-grown mice owned by a pet shop.
(a) Find the range. [2]
(b) Work out the number of these mice that have a length of at least 7.2 cm. [2]
(c) Sam owns 5 full-grown mice. Sam picks the third longest mouse and measures its length. Sam then looks at the box plot.
Sam says
This mouse is 7.35 cm long. Therefore, the mice I own are longer than the full-grown mice owned by the pet shop.
(i) Give a mathematical reason to support Sam’s conclusion. [1]
(ii) Give a mathematical reason why Sam’s conclusion may be unreliable. [1]
Mark scheme (a)
Answer
Marks
Part marks and guidance
0.64
2
M1 for 7.64 – 7 or 7 to 7.64
Mark scheme (b)
Answer
Marks
Part marks and guidance
45
2
M1 for 0.75 × 60 oe
Mark scheme (c)
Answer
Marks
Part marks and guidance
(i) Sam’s mouse/median is longer than the box plot’s median oe
1
With no incorrect statement Accept ‘middle’ for ‘median’ Accept 7.35 > 7.28 It is above the box plot median [7.28]
(ii) Spread/range/IQR of Sam’s lengths is not known oe or sample is too small oe
1
With no incorrect statement Accept ‘He only measured the middle mouse’ oe Accept ‘Lengths of Sam’s other mice are not known’ oe Sam only has 5 mice which makes the data unreliable for comparison
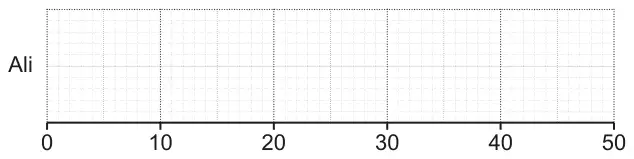
13 Ali and Beth take it in turns to play a computer game. On each turn, the player achieves a score out of 50. Ali and Beth play the computer game many times and record their scores.
(a) Ali’s scores are summarised below.
median = 31
highest score = 38
range = 23
lower quartile = 24
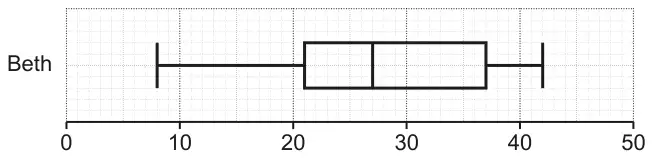
interquartile range = 11
Draw a box plot to show the distribution of Ali’s scores.
[3]
(b) This box plot shows the distribution of Beth’s scores.
Find the interquartile range of Beth’s scores. [2]
(c) Kareem says
Beth was more consistent than Ali because Beth had a lower median score.
Is his statement correct? Explain your reasoning. [2]
Mark scheme (a)
Answer
Marks
Part marks and guidance
Fully correct box plot
3
B1 for median at 31 B1 for highest at 38 and lowest at 15 B1 for UQ at 35 and LQ at 24
Use overlay and tolerance ±½ small square, condone freehand lines
Mark scheme (b)
Answer
Marks
Part marks and guidance
16
2
M1 for 21 or 37
Mark scheme (c)
Answer
Marks
Part marks and guidance
Accept “No” and any correct reasoning e.g. consistency is measured by [interquartile] range and Beth’s range is higher so less consistent
2
B1 for mention of [interquartile] range or spread or unclear acceptable statement
See appendix
Notes
(corrected from the printed mark scheme: the answer column prints “Bev’s range”; the question is about Beth)
Appendix: Exemplar responses for Q13(c)
Response
Mark
No + Ali is more consistent because his IQR is smaller
2
No + her data is more spread out
2
No + the median represents the average or middle value and not the range
2
No + median is just the middle mark
2
No+ the median does not measure consistency it is the range
2
No+ Kareem is wrong because Beth has the larger range
2
No + Beth is more consistent as her IQR/range is lower (1 for mention of IQR or range)
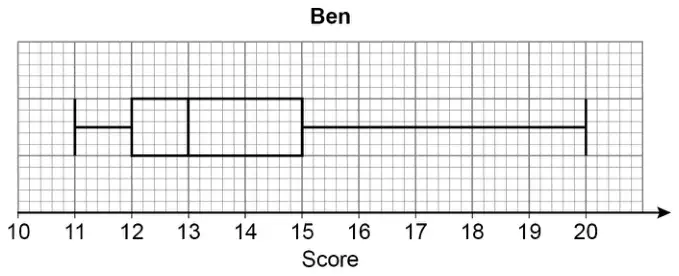
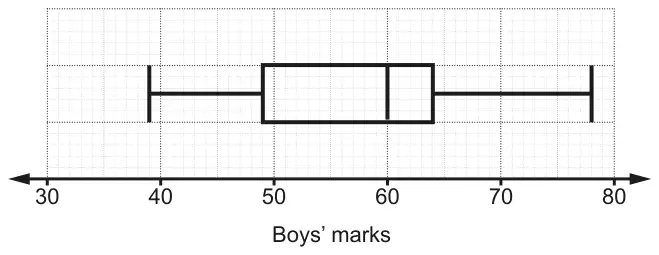
12 The box plot shows the distribution of the marks scored by some boys in a test.
(a) Find the interquartile range. [2]
(b) The marks for some girls in the same test are summarised below.
median = 58
lowest mark = 32
range = 44
upper quartile = 66
interquartile range = 12
Draw a box plot to show the distribution of the marks scored by the girls.
[3]
(c) Eleanor says
The boys did better, on average, in the test as they had a bigger interquartile range.
Is her statement correct? Explain your reasoning. [2]
Mark scheme (a)
Answer
Marks
Part marks and guidance
15
2
M1 for [UQ = ] 64 and [LQ = ] 49
Could be on diagram
Mark scheme (b)
Answer
Marks
Part marks and guidance
Correct box plot
3
B2 for 4 or 5 correct markers OR B1 for 3 correct markers or 54 or 76 soi
Use overlay, condone freehand
Mark scheme (c)
Answer
Marks
Part marks and guidance
Incorrect and Interquartile range is measure of spread not average oe or Incorrect and boys were less consistent because of the IQR oe
2
B1 for no/wrong decision and boys did better on average oe as median was larger or they had higher marks overall oe or boys were less consistent [and IQR not mentioned] oe
For 2 marks e.g. Incorrect and should have said the median is greater rather than IQR
Tolerance ½ square Award the markers even if not correctly representing the information eg if 17000 is plotted at 68000 still credit the markers at 28000, 37000 etc.
Mark scheme (d)
Answer
Marks
Part marks and guidance
Interquartile range is the same for both oe or Range for CC is higher oe
1
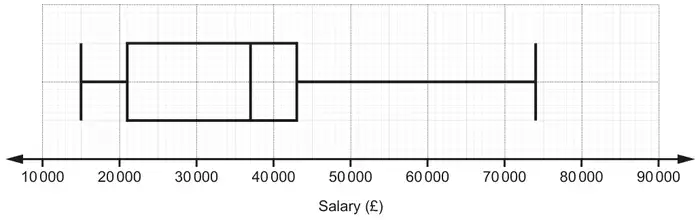
IQR = 22 000 for both
BB range = 59 000 CC range = 68 000
Average/median salaries are the same or The middle 50% of salaries for CC are higher
1
Medians = 37 000 for both
When given, figures should be correct.
Ignore additional incorrect comparisons provided they do not contradict a correct answer given
Do not accept comments just about a max (or min) salary B0 for CC has the highest salary B0 for highest paid worker at CC earns more than highest paid worker at BB B0 (some) people earn more at CC B0 for wider distribution at CC