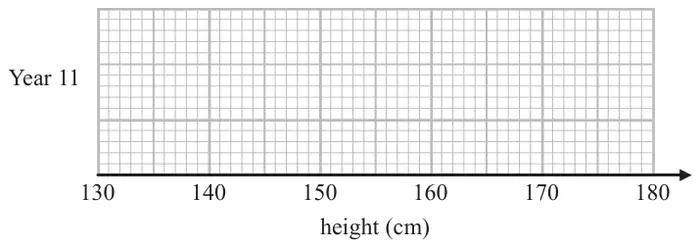
12 The table shows information about the heights, in cm, of a group of Year 11 girls.
height (cm)
least height
154
median
165
lower quartile
161
interquartile range
7
range
20
(a) Draw a box plot for this information.(3)
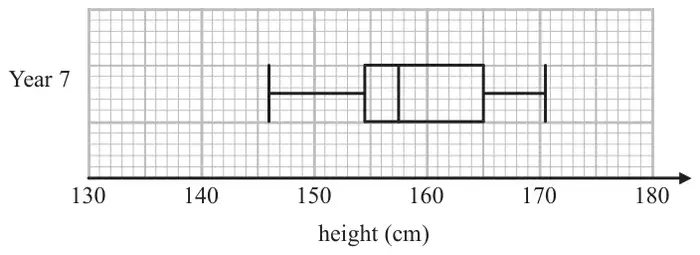
The box plot below shows information about the heights, in cm, of a group of Year 7 girls.
(b) Compare the distribution of heights of the Year 7 girls with the distribution of heights of the Year 11 girls. (2)
Mark scheme (a)
Working
Answer
Mark
Notes
\(161 + 7\) \(154 + 20\)
Box plot
M1
for method to find UQ (168) or highest value (174), may be implied by correct values plotted
M1
for showing a box and at least 3 correctly plotted values from 154, 161, 165, 168, 174
A1
for fully correct box plot
Mark scheme (b)
Working
Answer
Mark
Notes
Med IQR Range Y11 165 7 20 Y7 157.5 10.5 24.5
Comparison
C1
(ft) for comparison of the median
C1
(ft) for comparison of the spread NB: for award of both marks, at least one comparison must be in context. NB: figures need not be stated, but if they are they must be correct (ft)