
1MA0 Higher November 2015 Paper 2 Q18
18 The box plot shows information about the number of countries competing in each Winter Olympic Games since 1948
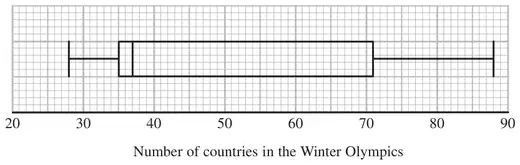
(a) Write down the median. (1)
(b) Work out the interquartile range. (2)
The table below shows information about the number of countries competing in each Summer Olympic Games since 1948
| Smallest | Lower quartile | Median | Upper quartile | Largest | |
|---|---|---|---|---|---|
| Number of countries | 59 | 83 | 121 | 199 | 204 |
*(c) Compare the two distributions. (2)
| Answer | Mark | Notes |
|---|---|---|
| 37 | 1 | B1 cao |
| Answer | Mark | Notes |
|---|---|---|
| 36 | 2 | M1 for identifying LQ and UQ e.g 35 – 71 A1 cao |
| Answer | Mark | Notes |
|---|---|---|
| 2 | C1 for a correct comparison of medians ft (a) C1 for a correct comparison of a measure of spread with correct figures ft (b) For the award of both marks at least one of the comparisons must be interpretative |