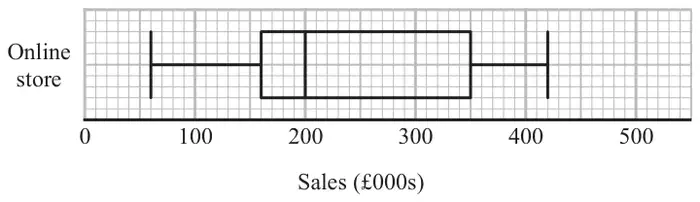
10 The box plot shows information about the sales, in thousands of pounds (£000s), of an online store each month.
Andrew says,
“Three quarters of the given data lies between 160 000 and 350 000 because these are the values of the lower quartile and the upper quartile.”
Andrew is wrong.
(a) Explain why. (1)
The table shows information about the sales, in £000s, in a shop each month.
Sales (£000s)
least value
30
lower quartile
80
median
170
upper quartile
260
greatest value
350
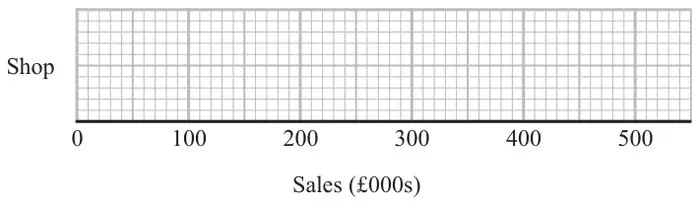
(b) On the grid below, draw a box plot for this information.(2)
(c) Compare the distribution of the sales of the online store with the distribution of the sales in the shop. (2)
Mark scheme (a)
Answer
Mark
Mark scheme
Explanation
C1
for explanation, eg Acceptable examples The IQR is half the data This is half the data \(\frac{3}{4}\) of the data is less than 350(000) \(\frac{3}{4}\) of the data is more than 160(000) \(\frac{3}{4}\) of the data is lies between 60(000) and 350(000) \(\frac{1}{2}\) of the data lies between 160(000) and 350(000)
Not acceptable examples The data lies between 160 and 350 The IQR is 190 (000) IQR = UQ – LQ The upper and lower quartiles represent half the data
Additional guidance
Zeros can be present or missing, but must be consistent.
Mark scheme (b)
Answer
Mark
Mark scheme
box plot drawn
B2
for fully correct box plot
(B1
for showing a box and at least 3 correctly plotted values)
Additional guidance
Box can be of any height. Accept ends that are marked (eg line, cross, dot) or defined by the end of the whiskers if clear
Mark scheme (c)
Answer
Mark
Mark scheme
decision and comparisons
C1
(ft) for correct comparison of medians eg the median for online is greater than the median for the shop, the shop takes less money from sales in general as the median is lower
C1
(ft) for a correct comparison of a measure of spread, eg the interquartile (range) of sales for the online store is greater than the IQR for the sales of the shop Comparisons for this mark can relate to the range or the IQR. For the award of both marks at least one comparison must be in the context of the question.
Additional guidance
Simply quoting values for median, range and IQR is insufficient, they must be compared
Median
Range
IQR
Online
200
360
190
Shop
170
320
180
Also accept figures as 000s as long as consistent. Figures need not be seen but if given they must be correct.