This year he put his tomato plants into two groups, group A and group B.
Harry gave fertiliser to the tomato plants in group A. He did not give fertiliser to the tomato plants in group B.
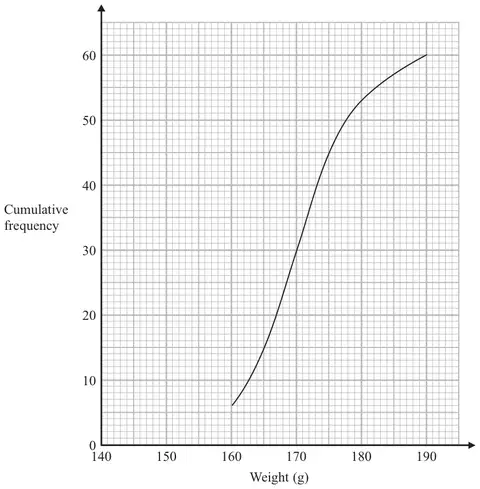
Harry weighed 60 tomatoes from group A. The cumulative frequency graph shows some information about these weights.
(a) Use the graph to find an estimate for the median weight. (1)
The 60 tomatoes from group A had a minimum weight of 153 grams and a maximum weight of 186 grams.
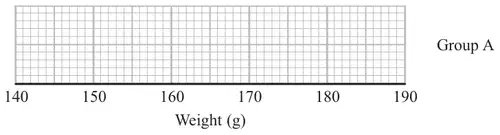
(b) Use this information and the cumulative frequency graph to draw a box plot for the 60 tomatoes from group A.(3)
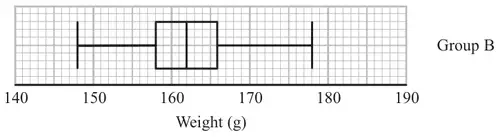
Harry did not give fertiliser to the tomato plants in group B. Harry weighed 60 tomatoes from group B. He drew this box plot for his results.
(c) Compare the distribution of the weights of the tomatoes from group A with the distribution of the weights of the tomatoes from group B. (2)
Mark scheme (a)
Answer
Mark
Notes
170
1
B1 accept answers in range 170 - 170.5 inclusive
Mark scheme (b)
Answer
Mark
Notes
3
B3 for box plot with all 3 aspects correct (overlay) aspect 1 : ends of whiskers at 153 and 186 aspect 2 : ends of box at 165 and 175 aspect 3 : median marked at 170 or ft (a) provided \(165 \lt\) (a) \(\lt 175\) (B2 for box plot with two aspects correct) (B1 for one aspect or correct quartiles and median identified) SC : B2 for all 5 values (153, 165, ‘170’, 175, 186) plotted
Mark scheme (c)
Answer
Mark
Notes
Two correct comparisons
2
B1 ft from (b) for a correct comparison of range or inter-quartile range eg. the range / iqr is smaller for group B than group A B1 ft from (b) for a correct comparison of median or upper quartile or lower quartile or minimum or maximum eg. the median in group A is greater than the median in group B