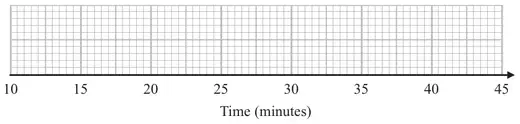
19 Sameena recorded the times, in minutes, some girls took to do a jigsaw puzzle.
Sameena used her results to work out the information in this table.
Minutes
Shortest time
18
Lower quartile
25
Median
29
Upper quartile
33
Longest time
44
(a) On the grid, draw a box plot to show the information in the table.(2)
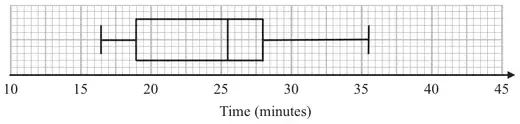
The box plot below shows information about the times, in minutes, some boys took to do the same jigsaw puzzle.
(b) Compare the distributions of the girls’ times and the boys’ times. (2)
Mark scheme (a)
Answer
Mark
Notes
Box plot
2
B2 cao (B1 for ends of whiskers at 18 and 44 (as part of a box plot diagram) OR for ends of box at 25 and 33 with median at 29)
Mark scheme (b)
Answer
Mark
Notes
2 comparisons
2
B2 ft for two comparisons with at least one referring to IQR or median values (B1 ft for one comparison of IQRs, medians, or other values) As well as median or interquartile range accept other valid references to spread if explained correctly within a statistical context. Statements need to be true.