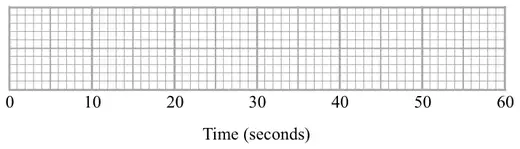
18 Here are the times, in seconds, that 15 people waited to be served at Rose’s garden centre.
5 9 11 14 15 20 22 25 27 27 28 30 32 35 44
(a) On the grid, draw a box plot for this information.(3)
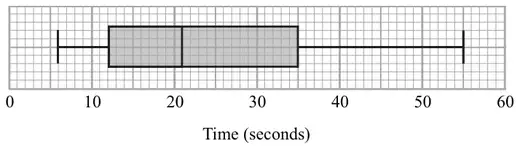
The box plot below shows the distribution of the times that people waited to be served at Green’s garden centre.
(b) Compare the distribution of the times that people waited at Rose’s garden centre and the distribution of the times that people waited at Green’s garden centre. (2)
Mark scheme (a)
Working
Answer
Mark
Notes
minimum = 5 lower quartile = 14 median = 25 upper quartile = 30 maximum = 44
box plot
3
B3 for fully correct box plot (B2 for at least 3 correct values plotted including box and tails or 5 correct values indicated) (B1 for at least 2 correct values plotted including box or tails or 3 or 4 correct values indicated)
Mark scheme (b)
Answer
Mark
Notes
comparisons
2
B1 for a correct comparison (ft) of medians B1 for a correct comparison (ft) of ranges or IQRs