
Higher June 2025 Paper 6 Q17
17 Two Year 11 classes, 11G and 11K, record their times for a race.
The box plots show the distribution of the times, in seconds, for each class.
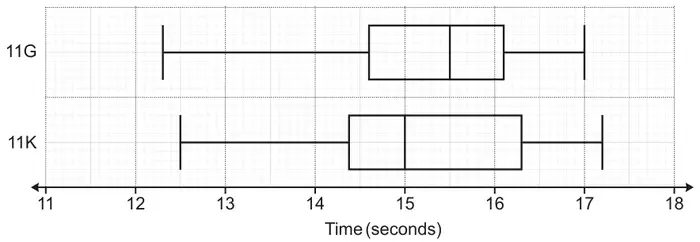
(a) Write down the percentage of students in 11G who took longer than 14.6 seconds. [1]
(b) Which class, 11G or 11K, was fastest on average?
Include values to support your decision. [2]
Include values to support your decision. [2]
| Answer | Marks | Part marks and guidance | |
|---|---|---|---|
| 75 | 1 | ||
| Answer | Marks | Part marks and guidance | |
|---|---|---|---|
| 11K and medians 15 and 15.5 | 2 | B1 for 11K with decision clearly supported by an attempted use of medians or for both medians correct | See Appendix For 2 marks, accept “average” and condone “mean” for median For 1 mark, use of “average/mean” must also have one correct median value Credit median values written on diagram only if referenced in their reason For 2 marks and B1, ignore mention of min/max/quartiles/IQR/range with correct or no values, as long as not an incorrect interpretation. If the interpretation is incorrect, or incorrect values are given, award 0 marks. |
Appendix: Question 17b
| Response | Mark |
|---|---|
| 11K the midpoint of the time they finished the race is 15 secs whereas for the other it is 15.5 seconds | 2 condone midpoint for median |
| 11K 50% of the class were faster than 15 seconds whereas in 11G 50% were faster than 15.5 seconds | 2 implies use of median |
| 11K the median is lower AND only 15 and 15.5 written on diagram | 2 |
| 11K because their median was 0.5 less than 11G | 1 median values need to be seen for 2 |
| 11K because the median time of 15 was quicker | 1 one correct median |
| 11K medians are 14.9 and 15.5 | 1 one correct median |
| 11K averages are 14.9 and 15.5 | 1 one correct median value so intent that “average” is median |
| 11K the median is lower | 1 intent to use median |
| 11K the median is lower (with lots of values written on diagram) | 1 intent to use median, choice of values |
| 11G the median is higher AND 15 and 15.5 written on diagram | 1 wrong conclusion, intent to use median and correct values |
| 11G averages are 15 and 15.5 | 1 wrong conclusion, condone “average” for median, both correct values |
| 11K has a bigger IQR and a lower median | 1bod IQR not relevant but true |
| 11K (15 and 15.5 stated but not called median/average/mean) | 1 both medians correct |
| 11K (no reason, 15 and 15.5 written on diagram) | 0 need a statement |
| 11K averages are 1.9 and 1.5 | 0 not median values |
| 11K has a lower average | 0 “average” requires one correct median value |
| 11K | 0 not supported by attempt to use medians |
| 11G medians are 14.9 and 15.5 | 0 wrong conclusion and an incorrect median |