
Higher June 2024 Paper 4 Q17
17 The box plot shows the distribution of the waiting time of cars at a road junction.
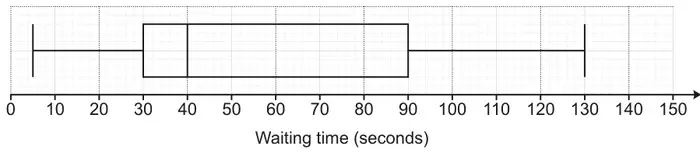
(a) Write down the median waiting time. [1]
(b) What percentage of the waiting times were less than 30 seconds? [1]
(c) Given that a randomly chosen car waited for more than 30 seconds, write down the probability that the car waited for more than 90 seconds. [1]
| Answer | Marks | Part marks and guidance | |
|---|---|---|---|
| 40 | 1 | ||
| Answer | Marks | Part marks and guidance | |
|---|---|---|---|
| 25 | 1 | ||
| Answer | Marks | Part marks and guidance | |
|---|---|---|---|
| \(\frac{1}{3}\) oe | 1 | e.g. \(\frac{25}{75}\) or 0.33[3…] or 33[.3…]% | |