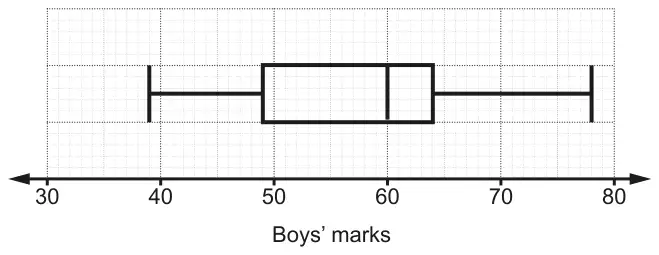
12 The box plot shows the distribution of the marks scored by some boys in a test.
(a) Find the interquartile range. [2]
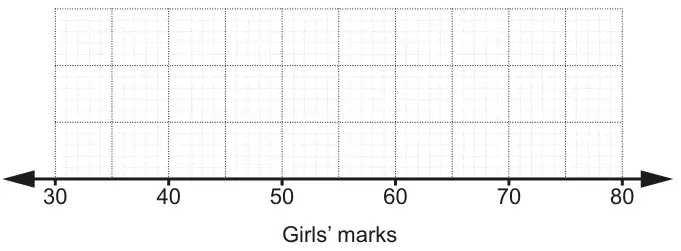
(b) The marks for some girls in the same test are summarised below.
median = 58
lowest mark = 32
range = 44
upper quartile = 66
interquartile range = 12
Draw a box plot to show the distribution of the marks scored by the girls.
[3]
(c) Eleanor says
The boys did better, on average, in the test as they had a bigger interquartile range.
Is her statement correct? Explain your reasoning. [2]
Mark scheme (a)
Answer
Marks
Part marks and guidance
15
2
M1 for [UQ = ] 64 and [LQ = ] 49
Could be on diagram
Mark scheme (b)
Answer
Marks
Part marks and guidance
Correct box plot
3
B2 for 4 or 5 correct markers OR B1 for 3 correct markers or 54 or 76 soi
Use overlay, condone freehand
Mark scheme (c)
Answer
Marks
Part marks and guidance
Incorrect and Interquartile range is measure of spread not average oe or Incorrect and boys were less consistent because of the IQR oe
2
B1 for no/wrong decision and boys did better on average oe as median was larger or they had higher marks overall oe or boys were less consistent [and IQR not mentioned] oe
For 2 marks e.g. Incorrect and should have said the median is greater rather than IQR