
Higher November 2018 Paper 4 Q15
15 The box plot shows the distribution of the runs scored by David in some cricket matches.
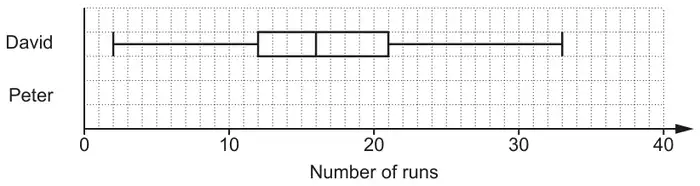
(a) Another player, Peter, has
- a median score of 26
- a highest score of 39
- a lowest score of 8
- a lower quartile of 14
- an inter-quartile range of 18.
Show the distribution of Peter’s scores as a box plot on the diagram above. [2]
(b) Decide whether David or Peter best satisfies each of these questions.
Give a reason for each of your decisions.
Give a reason for each of your decisions.
(i) Who scored more runs on average? [1]
(ii) Whose scores were more consistent? [1]
| Answer | Marks | Part marks and guidance | |
|---|---|---|---|
| Correct box plot | 2 | B1 for at least 3 correct elements | See overlay |
| Answer | Marks | Part marks and guidance | |
|---|---|---|---|
| (i) Peter and has a larger median oe | 1 | Condone average for median | |
| (ii) David and has a smaller IQR oe | 1 | Condone “neither as they have the same range” | |