
Higher November 2019 Paper 1 Q19
19 The box plots represent the distances run by the players in a football match.
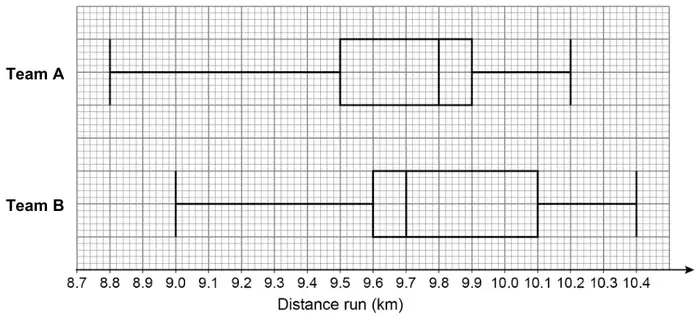
(a) On average, which team’s players ran further?
Tick a box.
- Team A
- Team B
Give a reason for your answer. [1 mark]
(b) The players in Team A ran more consistent distances.
How do the box plots show this? [1 mark]
| Answer | Mark | Comments |
|---|---|---|
| Team A and states that the median is higher or Team A and states that the averages are 9.8 and 9.7 | B1 |
Additional guidance
| If values are given for the medians they must be correct; Team A 9.8 and Team B 9.7 | |
| Accept medium or middle or midpoint for median | |
| Do not accept answers which also mention other statistical measures | |
| Team A and ‘The median is further’ | B1 |
| Team A and ‘A is 9.8 and B is 9.7’ | B1 |
| Team A and ‘A is 9.8’ | B0 |
| Team A and ‘The average is higher’ | B0 |
| Answer | Mark | Comments |
|---|---|---|
| States that the interquartile (range) is lower | B1 | oe accept ‘narrower box’ |
Additional guidance
| If values are given for the interquartile ranges they must be correct; Team A 0.4 and Team B 0.5 | |
| Apart from stating that the ranges are equal, do not accept answers which also mention other statistical measures | |
| The box is smaller | B1 |
| The distance between LQ and UQ is smaller | B1 |
| The box plot is smaller | B0 |
| 0.4 and 0.5 without IQR mentioned | B0 |