
Higher November 2021 Paper 5 Q12
12 The box plot shows the distribution of the lengths, in cm, of 60 full-grown mice owned by a pet shop.
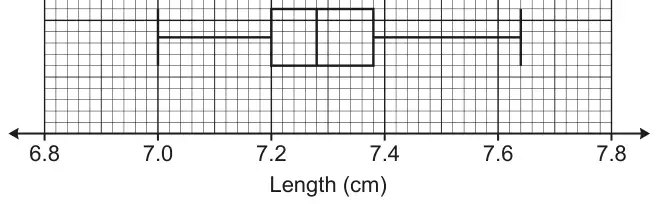
(a) Find the range. [2]
(b) Work out the number of these mice that have a length of at least 7.2 cm. [2]
(c) Sam owns 5 full-grown mice.
Sam picks the third longest mouse and measures its length.
Sam then looks at the box plot.
Sam picks the third longest mouse and measures its length.
Sam then looks at the box plot.
Sam says
This mouse is 7.35 cm long.
Therefore, the mice I own are longer than the full-grown mice owned by the pet shop.
(i) Give a mathematical reason to support Sam’s conclusion. [1]
(ii) Give a mathematical reason why Sam’s conclusion may be unreliable. [1]
| Answer | Marks | Part marks and guidance | |
|---|---|---|---|
| 0.64 | 2 | M1 for 7.64 – 7 or 7 to 7.64 | |
| Answer | Marks | Part marks and guidance | |
|---|---|---|---|
| 45 | 2 | M1 for 0.75 × 60 oe | |
| Answer | Marks | Part marks and guidance | |
|---|---|---|---|
| (i) Sam’s mouse/median is longer than the box plot’s median oe | 1 | With no incorrect statement Accept ‘middle’ for ‘median’ Accept 7.35 > 7.28 It is above the box plot median [7.28] | |
| (ii) Spread/range/IQR of Sam’s lengths is not known oe or sample is too small oe | 1 | With no incorrect statement Accept ‘He only measured the middle mouse’ oe Accept ‘Lengths of Sam’s other mice are not known’ oe Sam only has 5 mice which makes the data unreliable for comparison | |