15 The students in a class kept a record of the amount of time, in minutes, they spent doing homework last week.
The table shows information about the amount of time the girls spent doing homework last week.
Minutes
Least amount of time
60
Range
230
Median
170
Lower quartile
100
Upper quartile
220
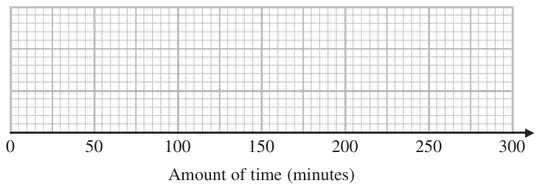
(a) On the grid, draw a box plot for the information in the table.(2)
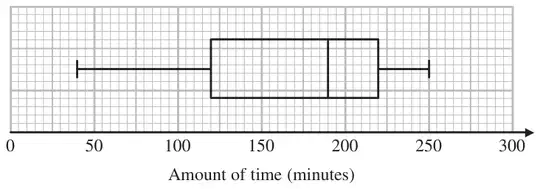
The box plot below shows information about the amount of time the boys spent doing homework last week.
*(b) Compare the amount of time the girls spent doing homework with the amount of time the boys spent doing homework. (2)
Mark scheme (a)
Answer
Mark
Notes
correct box plot
2
M1 for a box drawn with at least 2 correct points from LQ, Median and UQ or with maximum value of 290 plotted A1 for a fully correct box plot
Mark scheme (b)
Working
Answer
Mark
Notes
girls
boys
Med
170
190
Range
230
210
IQR
120
100
2 comparisons
2
C1 for a correct comparison of a measure of spread (using either range or IQR) or ft their box plot C1 for a correct comparison of medians (accept averages) For the award of both marks at least one of these comparisons must be in the context of the question.