
1MA0 Higher November 2016 Paper 1 Q18
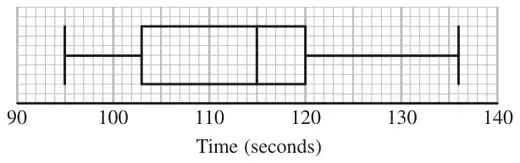
*18 Tom recorded the times, in seconds, some boys took to complete an obstacle course.
He drew this box plot for his results.
Tom also recorded the times some girls took to complete the obstacle course.
Here are the times, in seconds, for the girls.
99 101 103 106 108 109 110 110 111 112
113 114 115 115 117 120 124 125 132
Compare the distribution of the times for the boys with the distribution of the times for the girls. (4)
| Working | Answer | Mark | Notes | ||||||||||||
|---|---|---|---|---|---|---|---|---|---|---|---|---|---|---|---|
| Comparison of data | 4 | B1 for correct median for girls or boys B1 for any correct range or IQR C1 for a correct comparison of the medians C1 ft for a correct comparison of the ranges or IQRs For the award of both C marks at least one of the comparisons made must be in the context of the question and all figures used for comparisons correct. OR B2 for an accurately drawn boxplot ( superimposed) C1 for a correct comparison of the medians C1 for a correct comparison of the ranges or IQRs For the award of both C marks at least one of the comparisons made must be in the context of the question |