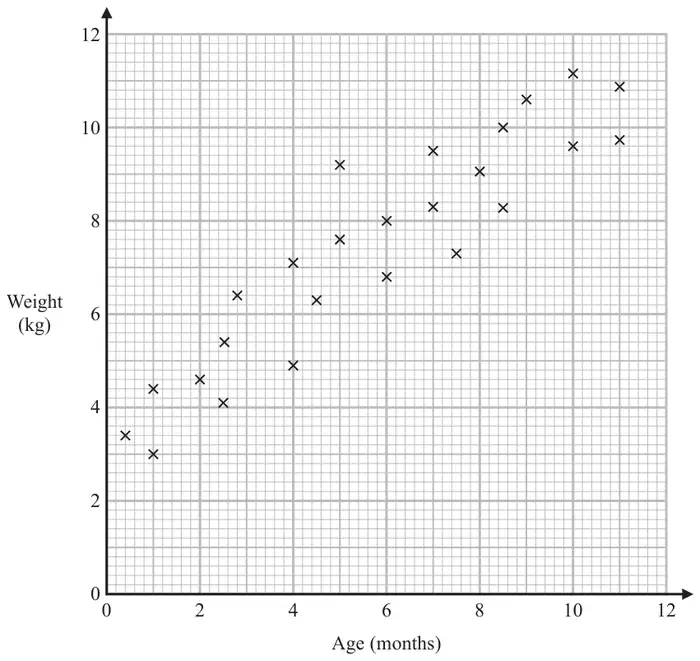
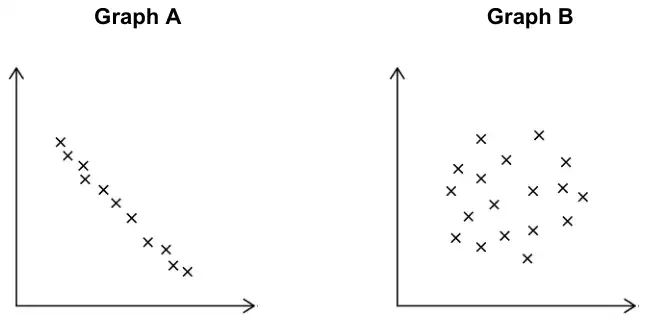
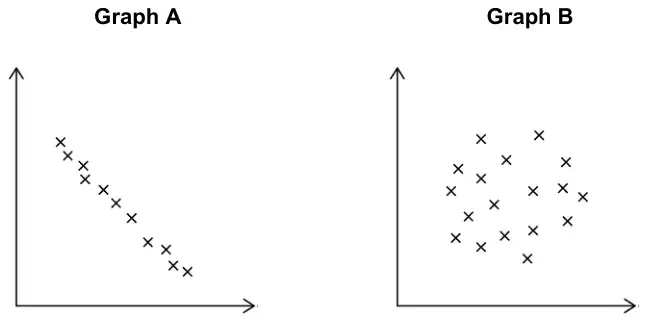
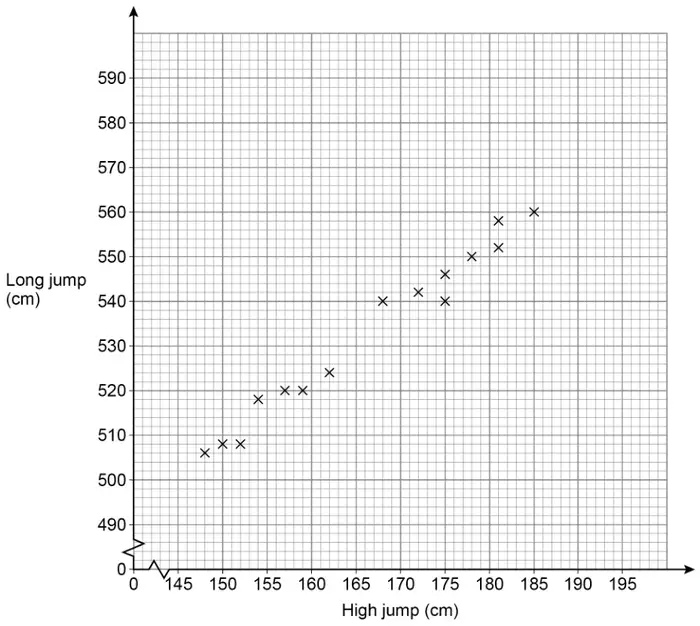
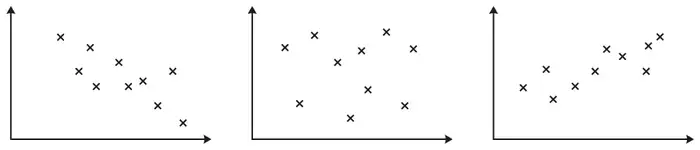
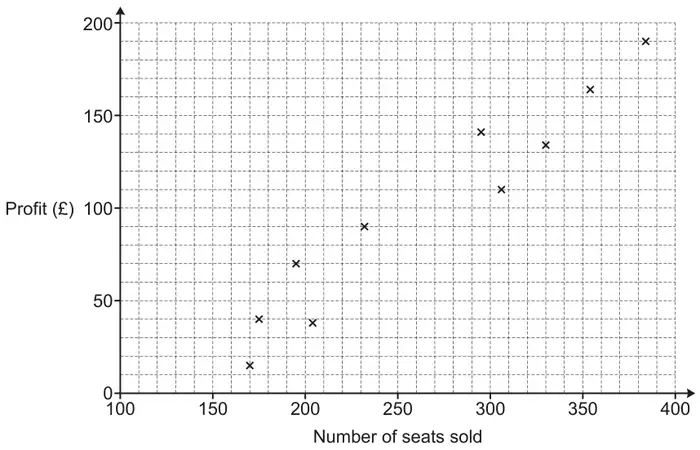
25 The scatter graph shows information about the ages and weights of some babies.
(a) Describe the relationship between the age and the weight of the babies. (1)
Another baby has a weight of 5.8 kg
(b) Using the scatter graph, find an estimate for the age of this baby. (2)
Mark scheme (a)
Answer
Mark
Mark scheme
Description
C1
for a valid description of the relationship Acceptable examples As age increases, weight increases The older you are the greater the weight Positive correlation
Not acceptable examples Positive (relationship) age and weight are in proportion strong correlation or correlation is increasing as the babies get older the heavier they get, negative correlation they are directly proportional, weight goes up as age goes up
Additional guidance
Accept positive correlation Ignore any comment about strength
Mark scheme (b)
Answer
Mark
Mark scheme
2.5 to 4.5
B2
for an answer in the range 2.5 to 4.5
(B1
for a suitable line of best fit drawn or for a point on the grid at \((x, 5.8)\) where \(x\) lies between 2.5 and 4.5 or a horizontal line drawn from 5.8 across to \((x, 5.8)\) where \(x\) is in the range 2.5 to 4.5)
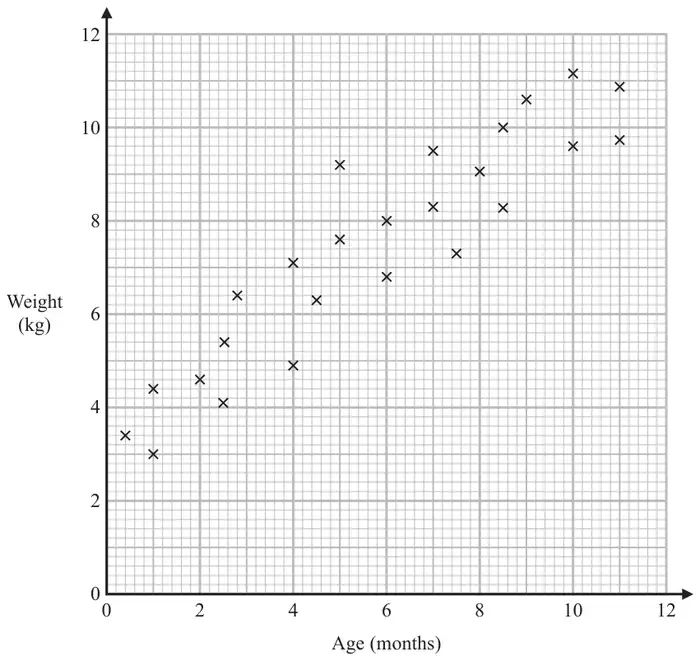
6 The scatter graph shows information about the ages and weights of some babies.
(a) Describe the relationship between the age and the weight of the babies. (1)
Another baby has a weight of 5.8 kg
(b) Using the scatter graph, find an estimate for the age of this baby. (2)
Mark scheme (a)
Answer
Mark
Mark scheme
Description
C1
for a valid description of the relationship Acceptable examples As age increases, weight increases The older you are the greater the weight Positive correlation
Not acceptable examples Positive (relationship) age and weight are in proportion strong correlation or correlation is increasing as the babies get older the heavier they get, negative correlation they are directly proportional, weight goes up as age goes up
Additional guidance
Accept positive correlation Ignore any comment about strength
Mark scheme (b)
Answer
Mark
Mark scheme
2.5 to 4.5
B2
for an answer in the range 2.5 to 4.5
(B1
for a suitable line of best fit drawn or for a point on the grid at \((x, 5.8)\) where \(x\) lies between 2.5 and 4.5 or a horizontal line drawn from 5.8 across to \((x, 5.8)\) where \(x\) is in the range 2.5 to 4.5)
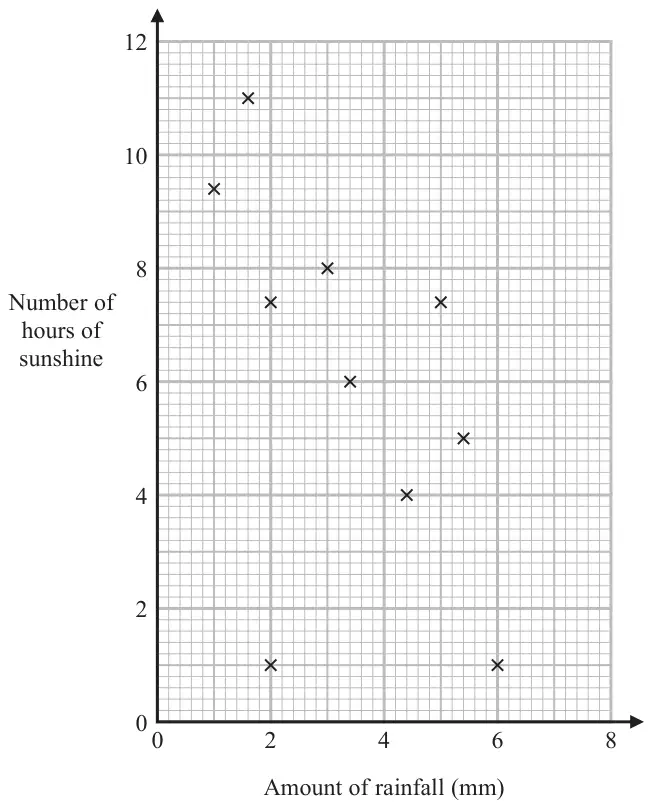
18 The scatter graph shows information about the amount of rainfall, in mm, and the number of hours of sunshine for each of ten English towns on the same day.
One of the points is an outlier.
(a) Write down the coordinates of this point. (1)
(b) Ignoring the outlier, describe the relationship between the amount of rainfall and the number of hours of sunshine. (1)
On the same day in another English town there were 7 hours of sunshine.
(c) Using the scatter graph, estimate the amount of rainfall in this town on this day. (2)
Mark scheme (a)
Answer
Mark
Mark scheme
(2, 1)
B1
cao
Mark scheme (b)
Answer
Mark
Mark scheme
Description
C1
correct description, eg as the amount of rainfall decreases the number of hours of sunshine increases
Additional guidance
Accept negative correlation Ignore any comment about strength Any numbers used in the description must be within tolerance
Mark scheme (c)
Answer
Mark
Mark scheme
3 to 4
M1
for a suitable line of best fit drawn, or for a point marked at \((x, 7)\), or a horizontal line drawn from 7 across to \((x, 7)\) where \(x\) is in the range 2.5 to 4
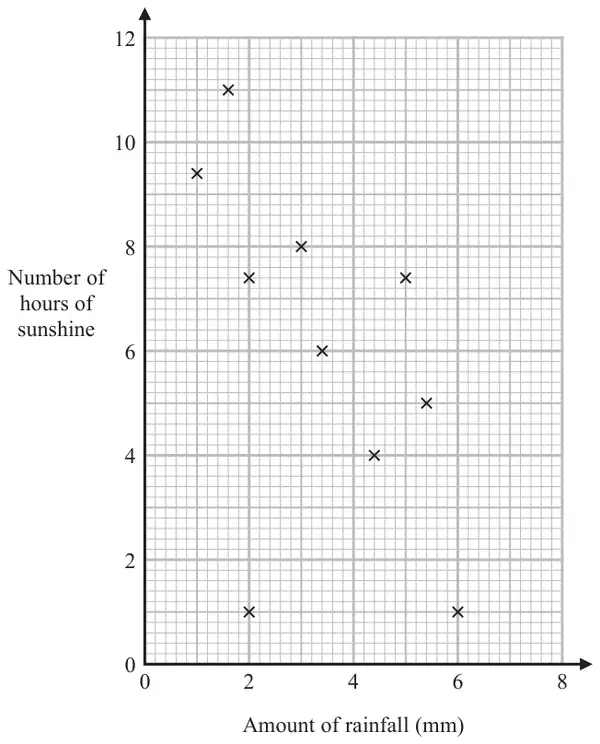
1 The scatter graph shows information about the amount of rainfall, in mm, and the number of hours of sunshine for each of ten English towns on the same day.
One of the points is an outlier.
(a) Write down the coordinates of this point. (1)
(b) Ignoring the outlier, describe the relationship between the amount of rainfall and the number of hours of sunshine. (1)
On the same day in another English town there were 7 hours of sunshine.
(c) Using the scatter graph, estimate the amount of rainfall in this town on this day. (2)
Mark scheme (a)
Answer
Mark
Mark scheme
(2, 1)
B1
cao
Mark scheme (b)
Answer
Mark
Mark scheme
Description
C1
correct description, eg as the amount of rainfall decreases the number of hours of sunshine increases
Additional guidance
Accept negative correlation Ignore any comment about strength Any numbers used in the description must be within tolerance
Mark scheme (c)
Answer
Mark
Mark scheme
3 to 4
M1
for a suitable line of best fit drawn, or for a point marked at \((x, 7)\), or a horizontal line drawn from 7 across to \((x, 7)\) where \(x\) is in the range 2.5 to 4
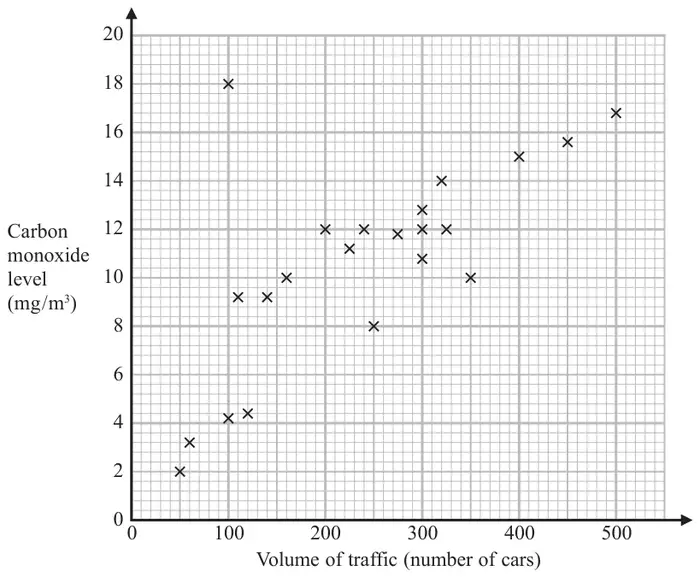
21 The scatter graph shows information about the volume of traffic and the carbon monoxide level at a point on a road each day for 22 days.
One point is an outlier.
(a) Write down the coordinates of this point. (1)
For another day, 370 cars pass the point on the road.
(b) Estimate the carbon monoxide level for this day. (2)
Alfie says,
“Because there is an outlier, there is no correlation.”
(c) Is Alfie correct? You must give a reason for your answer. (1)
Mark scheme (a)
Answer
Mark
Mark scheme
(100, 18)
B1
cao
Mark scheme (b)
Answer
Mark
Mark scheme
12.8 to 14.8
M1
for a method to read off eg line of best fit or line up from 370 or for a point on the grid at \((370, y)\) where \(y\) lies between 12.8 and 14.8
A1
for an answer in the range 12.8 to 14.8
Mark scheme (c)
Answer
Mark
Mark scheme
Decision and statement
C1
for decision and statement Acceptable examples No, as this point can be disregarded from the general trend No, ignore this point No, the correlation is positive No, because even with an outlier you can still have a negative or positive correlation. No, there is still a correlation. No, as you can use the rest of the data to determine a correlation. No, as outlier does not affect the majority No as a line of best fit can still be drawn No, it is an anomaly Not acceptable examples Yes, … Outliers can be ignored [no decision] No, the outlier can be ignored so the correlation is negative No there are other things that can affect the test
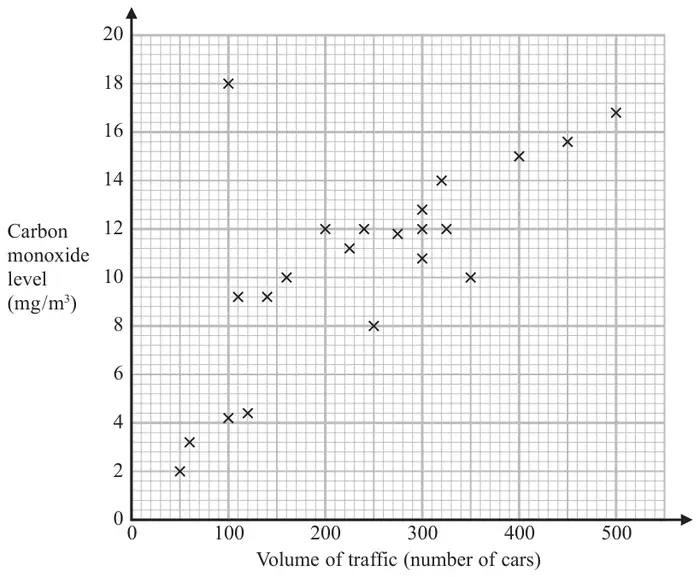
1 The scatter graph shows information about the volume of traffic and the carbon monoxide level at a point on a road each day for 22 days.
One point is an outlier.
(a) Write down the coordinates of this point. (1)
For another day, 370 cars pass the point on the road.
(b) Estimate the carbon monoxide level for this day. (2)
Alfie says, “Because there is an outlier, there is no correlation.”
(c) Is Alfie correct? You must give a reason for your answer. (1)
Mark scheme (a)
Answer
Mark
Mark scheme
(100, 18)
B1
cao
Mark scheme (b)
Answer
Mark
Mark scheme
12.8 to 14.8
M1
for a method to read off eg line of best fit or line up from 370 or for a point on the grid at \((370, y)\) where \(y\) lies between 12.8 and 14.8
A1
for an answer in the range 12.8 to 14.8
Mark scheme (c)
Answer
Mark
Mark scheme
Decision and statement
C1
for decision and statement Acceptable examples No, as this point can be disregarded from the general trend No, ignore this point No, the correlation is positive No, because even with an outlier you can still have a negative or positive correlation. No, there is still a correlation. No, as you can use the rest of the data to determine a correlation. No, as outlier does not affect the majority No as a line of best fit can still be drawn No, it is an anomaly
Not acceptable examples Yes, …. Outliers can be ignored [no decision] No, the outlier can be ignored so the correlation is negative No there are other things that can affect the test
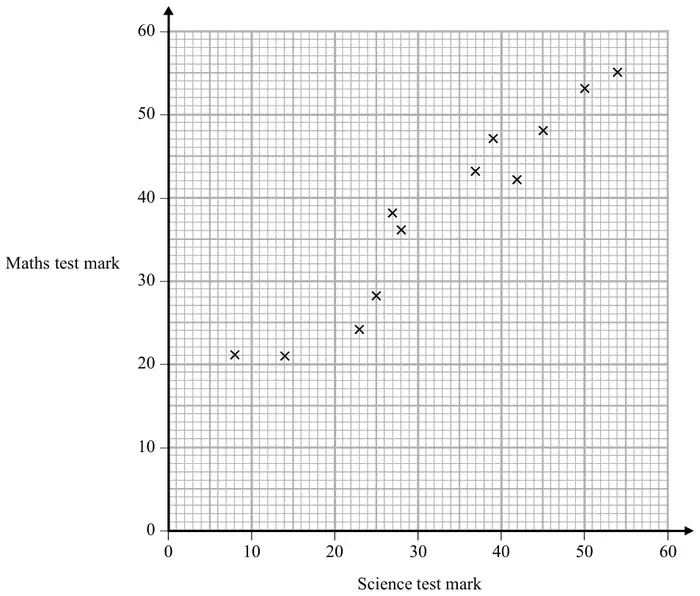
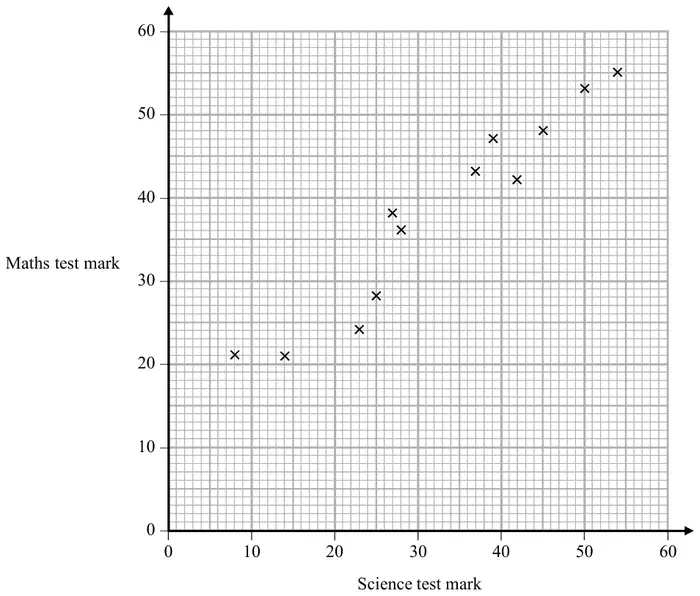
24 The scatter graph shows information about the marks a group of students got in a Science test and in a Maths test.
Jamie got a mark of 34 in the Science test.
Using the scatter graph, find an estimate for Jamie’s mark in the Maths test. (2)
Mark scheme
Answer
Mark
Mark scheme
35 to 42
M1
for drawing a suitable line of best fit or for a line from \(x = 34\) or for a point marked on the grid at \((34, y)\), \(y\) in the range 33 to 44
A1
answer in the range 35 to 42
Additional guidance
Line at \(x = 34\) does not have to be full length of grid but should be in or reach the data set. Acceptable values for the data set are \(y = 33\) to \(y = 44\)
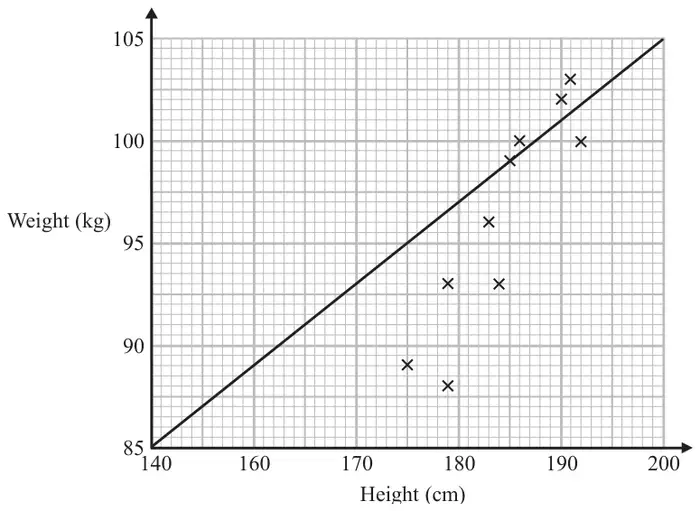
21 Sean has information about the height, in cm, and the weight, in kg, of each of ten rugby players.
He is asked to draw a scatter graph and a line of best fit for this information.
Here is his answer.
Sean has plotted the points accurately.
Write down two things that are wrong with his answer. (2)
Mark scheme
Answer
Mark
Mark scheme
statements
C1
for lobf incorrect
Acceptable examples lobf lobf does not suit all points/not a lobf lobf wrong since hits \(x\) axis/is inaccurate/should be amongst the crosses lobf goes through the origin/through one point Not acceptable examples no correlation/there is no title
C1
for height scale not linear
Acceptable examples 150 missing Height not linear / Height numbers going up wrong Not acceptable examples 150 graph does not start at 140/graph does not start at 0 height should start at 170
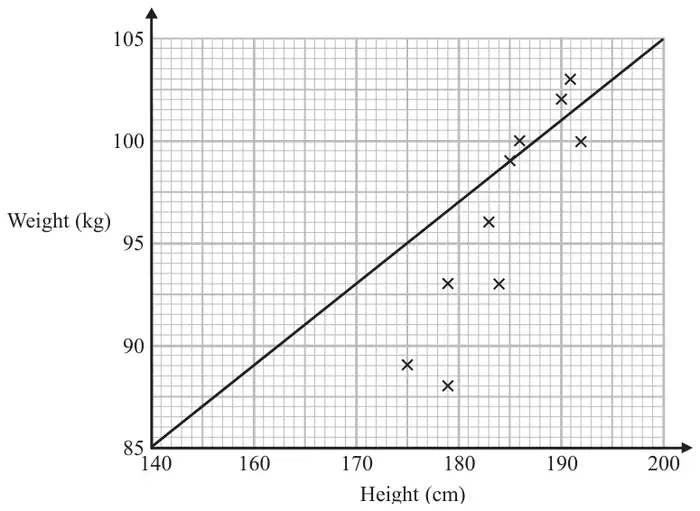
2 Sean has information about the height, in cm, and the weight, in kg, of each of ten rugby players.
He is asked to draw a scatter graph and a line of best fit for this information.
Here is his answer.
Sean has plotted the points accurately.
Write down two things that are wrong with his answer. (2)
Mark scheme
Answer
Mark
Mark scheme
statements
C1
for lobf incorrect
Acceptable examples lobf lobf does not suit all points/not a lobf lobf wrong since hits \(x\) axis/is inaccurate/should be amongst the crosses lobf goes through the origin/through one point Not acceptable examples no correlation/there is no title
C1
for height scale not linear
Acceptable examples 150 missing Height not linear / Height numbers going up wrong Not acceptable examples 150 graph does not start at 140/graph does not start at 0 height should start at 170
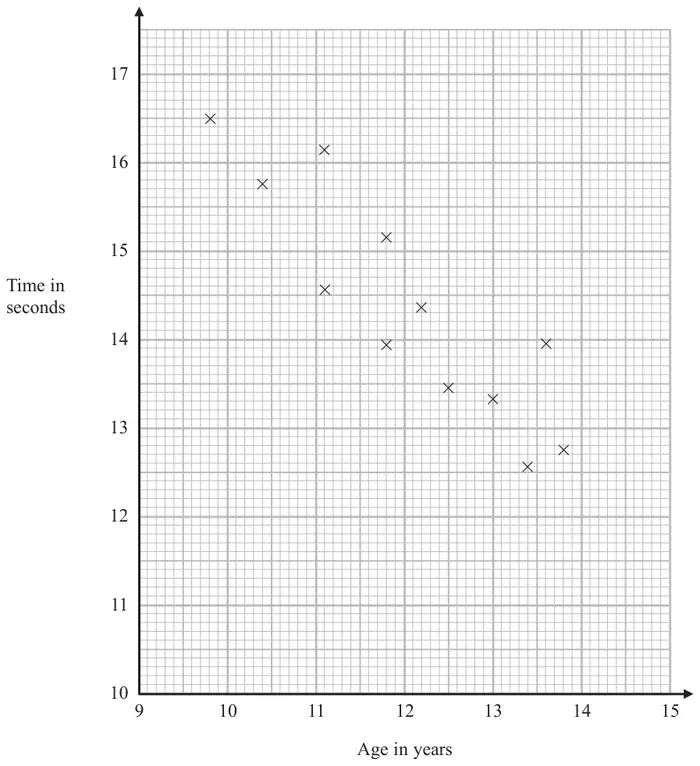
19 The scatter diagram shows information about 12 girls. It shows the age of each girl and the best time she takes to run 100 metres.
(a) Write down the type of correlation. (1)
Kristina is 11 years old. Her best time to run 100 metres is 12 seconds.
The point representing this information would be an outlier on the scatter diagram.
(b) Explain why. (1)
Debbie is 15 years old. Debbie says,
“The scatter diagram shows I should take less than 12 seconds to run 100 metres.”
(c) Comment on what Debbie says. (1)
Mark scheme (a)
Answer
Mark
Mark scheme
negative
B1
cao
Additional guidance
Ignore any description of a relationship and any reference to strength of correlation
Mark scheme (b)
Answer
Mark
Mark scheme
Explanation
C1
for a correct explanation, eg “not in line with the trend of the other points” “does not fit in with the correlation” “is far away from the other points or line of best fit”
Mark scheme (c)
Answer
Mark
Mark scheme
Comment
C1
for an explanation eg “point would be outside of the range of the scatter diagram”
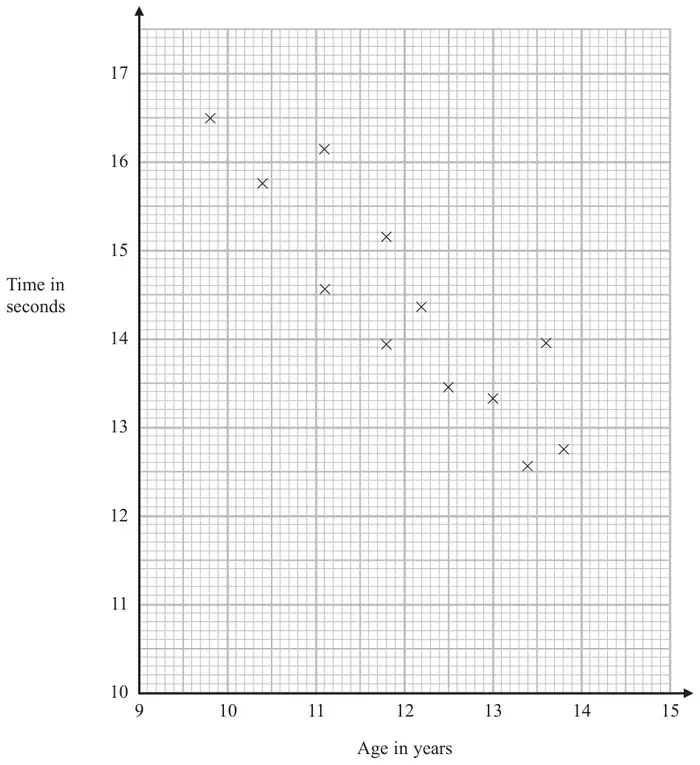
1 The scatter diagram shows information about 12 girls. It shows the age of each girl and the best time she takes to run 100 metres.
(a) Write down the type of correlation. (1)
Kristina is 11 years old. Her best time to run 100 metres is 12 seconds.
The point representing this information would be an outlier on the scatter diagram.
(b) Explain why. (1)
Debbie is 15 years old. Debbie says,
“The scatter diagram shows I should take less than 12 seconds to run 100 metres.”
(c) Comment on what Debbie says. (1)
Mark scheme (a)
Answer
Mark
Mark scheme
negative
B1
cao
Additional guidance
Ignore any description of a relationship and any reference to strength of correlation
Mark scheme (b)
Answer
Mark
Mark scheme
Explanation
C1
for a correct explanation, eg “not in line with the trend of the other points” “does not fit in with the correlation” “is far away from the other points or line of best fit”
Mark scheme (c)
Answer
Mark
Mark scheme
Comment
C1
for an explanation eg “point would be outside of the range of the scatter diagram”
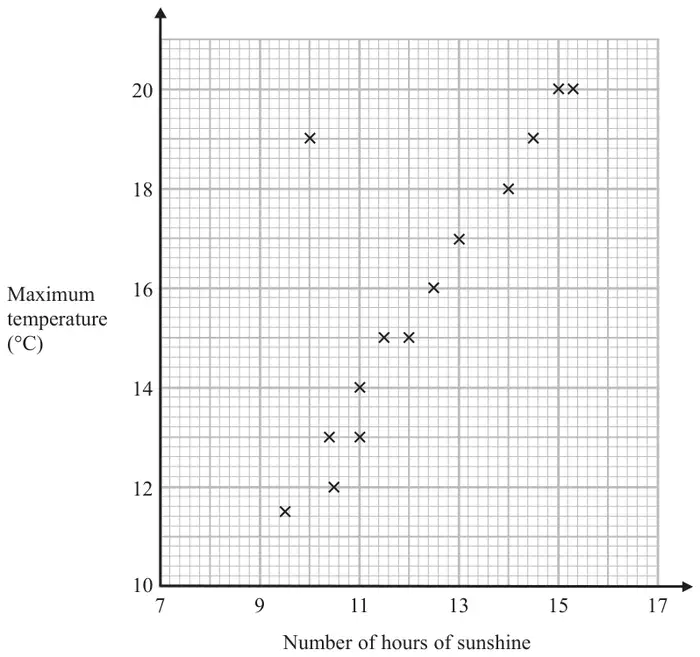
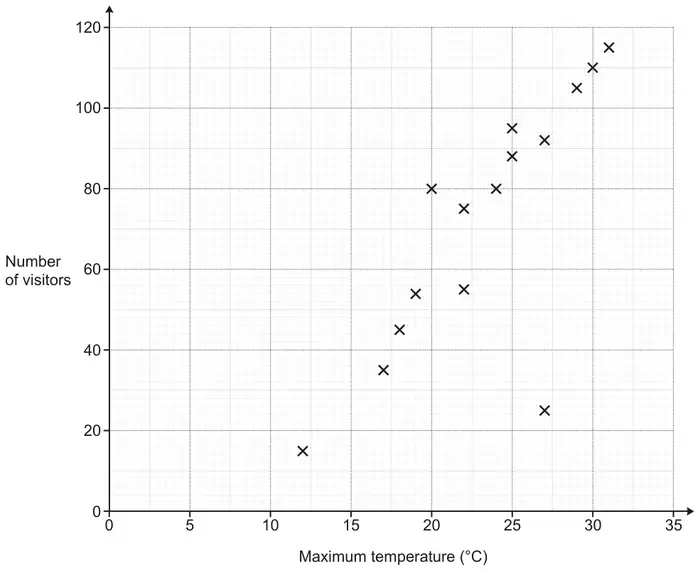
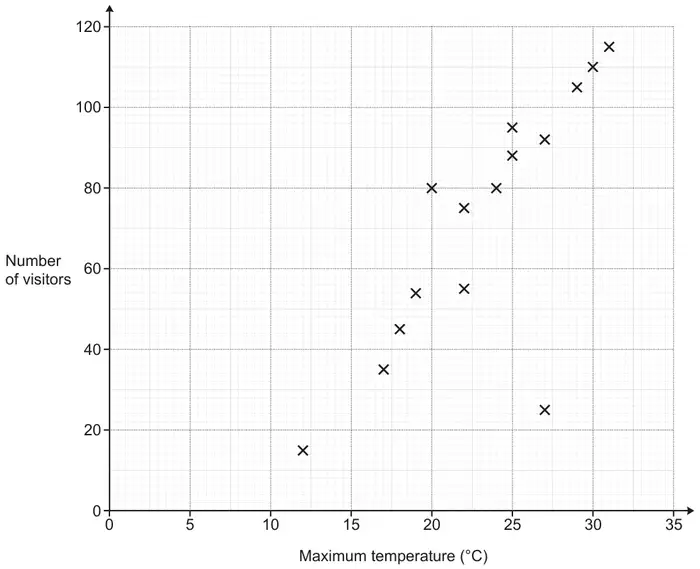
21 The scatter graph shows the maximum temperature and the number of hours of sunshine in fourteen British towns on one day.
One of the points is an outlier.
(a) Write down the coordinates of this point. (1)
(b) For all the other points write down the type of correlation. (1)
On the same day, in another British town, the maximum temperature was 16.4°C.
(c) Estimate the number of hours of sunshine in this town on this day. (2)
A weatherman says,
“Temperatures are higher on days when there is more sunshine.”
(d) Does the scatter graph support what the weatherman says? Give a reason for your answer. (1)
Mark scheme (a)
Answer
Mark
Notes
(10, 19)
B1
cao
Mark scheme (b)
Answer
Mark
Notes
Positive
C1
positive (correlation)
Mark scheme (c)
Answer
Mark
Notes
12 to 13
M1
for an appropriate line of best fit drawn, or a point marked at \((x, 16.4)\) or a horizontal line drawn from 16.4 across to \((x, 16.4)\) where \(x\) is in the range 12 to 13
A1
hours given in the range 12 to 13
Mark scheme (d)
Answer
Mark
Notes
explanation
C1
(yes) e.g. as the majority of points for high temperature appear when there are more hours of sunshine (positive correlation)
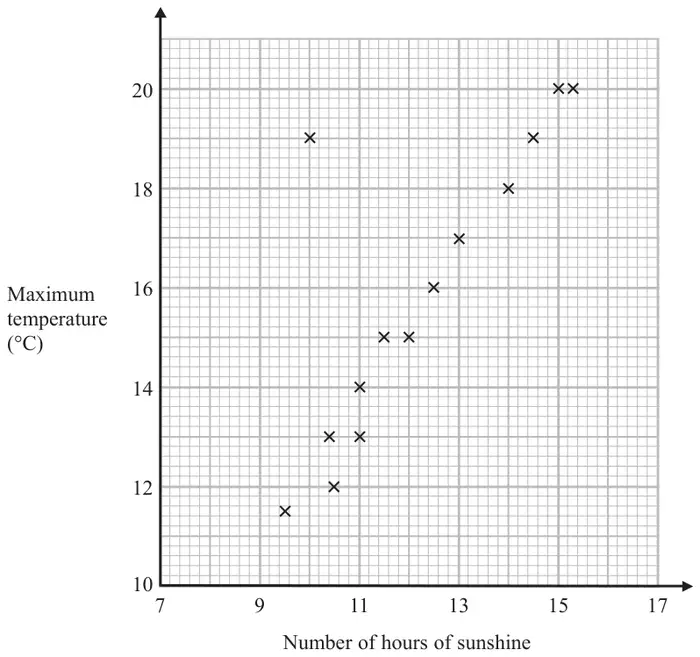
1 The scatter graph shows the maximum temperature and the number of hours of sunshine in fourteen British towns on one day.
One of the points is an outlier.
(a) Write down the coordinates of this point. (1)
(b) For all the other points write down the type of correlation. (1)
On the same day, in another British town, the maximum temperature was 16.4°C.
(c) Estimate the number of hours of sunshine in this town on this day. (2)
A weatherman says,
“Temperatures are higher on days when there is more sunshine.”
(d) Does the scatter graph support what the weatherman says? Give a reason for your answer. (1)
Mark scheme (a)
Answer
Mark
Notes
(10, 19)
B1
cao
Mark scheme (b)
Answer
Mark
Notes
Positive
C1
positive (correlation)
Mark scheme (c)
Answer
Mark
Notes
12 to 13
M1
for an appropriate line of best fit drawn, or a point marked at \((x, 16.4)\) or a horizontal line drawn from 16.4 across to \((x, 16.4)\) where \(x\) is in the range 12 to 13
A1
hours given in the range 12 to 13
Mark scheme (d)
Answer
Mark
Notes
explanation
C1
(yes) e.g. as the majority of points for high temperature appear when there are more hours of sunshine (positive correlation)
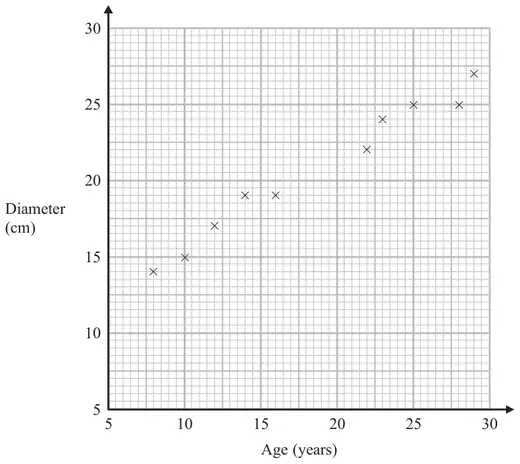
25 The scatter graph shows information about ten trees of the same type. It shows the age and the diameter of the trunk of each tree.
(a) What type of correlation does this scatter graph show? (1)
Another tree of the same type has a trunk with diameter 21 cm.
(b) Estimate the age of this tree. (2)
Mark scheme (a)
Answer
Mark
Notes
positive
1
B1 cao
Mark scheme (b)
Answer
Mark
Notes
17 – 21.5
2
M1 for a single line segment with positive gradient that could be used as a line of best fit or a horizontal line from 21 or a point plotted at \((x, 21)\) where \(x\) is in the range 17 – 21.5 A1 for answer in range 17 – 21.5
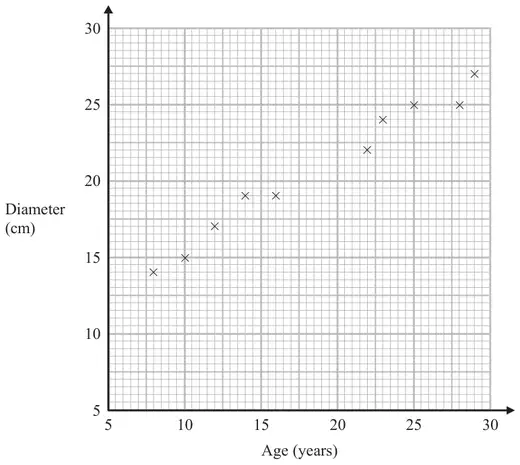
4 The scatter graph shows information about ten trees of the same type. It shows the age and the diameter of the trunk of each tree.
(a) What type of correlation does this scatter graph show? (1)
Another tree of the same type has a trunk with diameter 21 cm.
(b) Estimate the age of this tree. (2)
Mark scheme (a)
Answer
Mark
Notes
positive
1
B1 cao
Mark scheme (b)
Answer
Mark
Notes
17 – 21.5
2
M1 for a single line segment with positive gradient that could be used as a line of best fit or a horizontal line from 21 or a point plotted at (\(x\), 21) where \(x\) is in the range 17 – 21.5 A1 for answer in range 17 – 21.5
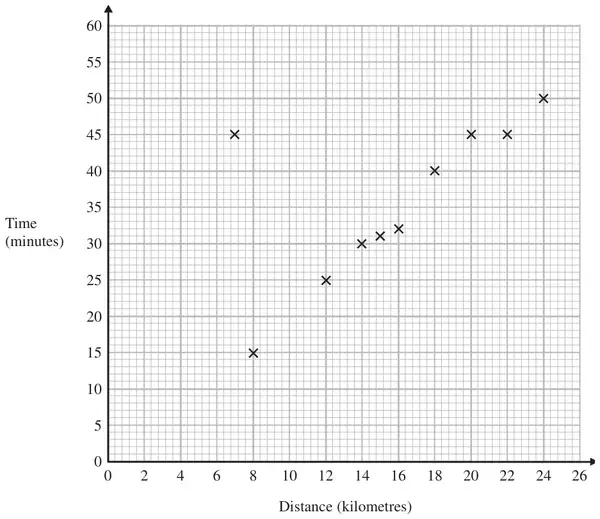
22 A delivery driver records for each delivery the distance he drives and the time taken. The scatter graph shows this information.
For another delivery he drives 22 kilometres and takes 50 minutes.
(a) Show this information on the scatter graph. (1)
(b) What type of correlation does the scatter graph show? (1)
The driver has to drive a distance of 10 km for his next delivery.
(c) Estimate the time taken for this delivery. (2)
During one of the deliveries, the driver was delayed by road works.
(d) Using the graph write down the time taken for this delivery. (1)
Mark scheme (a)
Answer
Mark
Notes
Point plotted
1
B1 cao
Mark scheme (b)
Answer
Mark
Notes
positive
1
B1 cao
Mark scheme (c)
Answer
Mark
Notes
18 – 22
2
M1 for a single line segment with positive gradient that could be used as a line of best fit or a vertical line from 10 or a point plotted at (10, \(y\)) where \(y\) is in the range 18 – 22 A1 18 – 22
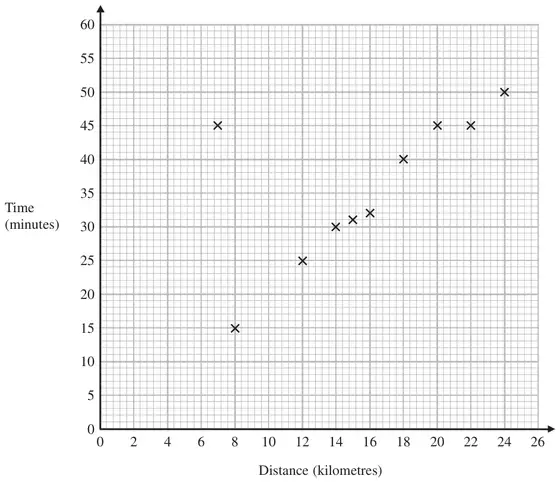
2 A delivery driver records for each delivery the distance he drives and the time taken. The scatter graph shows this information.
For another delivery he drives 22 kilometres and takes 50 minutes.
(a) Show this information on the scatter graph. (1)
(b) What type of correlation does the scatter graph show? (1)
The driver has to drive a distance of 10 km for his next delivery.
(c) Estimate the time taken for this delivery. (2)
During one of the deliveries, the driver was delayed by road works.
(d) Using the graph write down the time taken for this delivery. (1)
Mark scheme (a)
Answer
Mark
Notes
Point plotted
1
B1 cao
Mark scheme (b)
Answer
Mark
Notes
positive
1
B1 cao
Mark scheme (c)
Answer
Mark
Notes
18 - 22
2
M1 for a single line segment with a positive gradient that could be used as a line of best fit or a vertical line from 10 or a point plotted at \((10, y)\) where \(y\) is in the range 18 - 22 A1 18 - 22
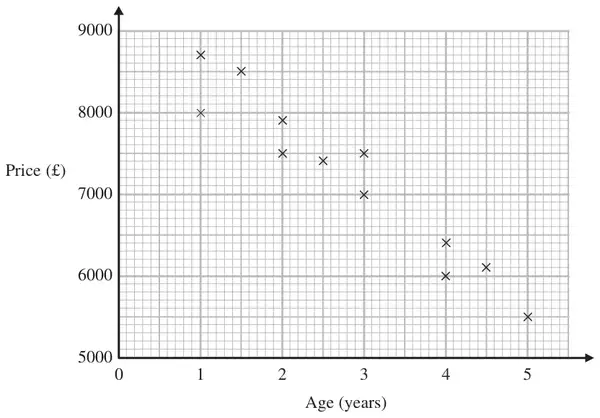
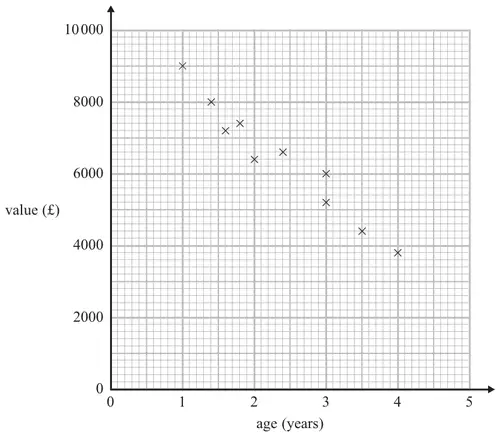
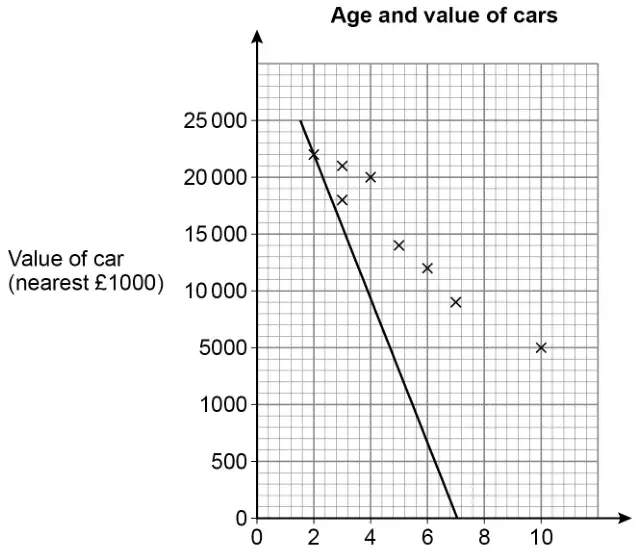
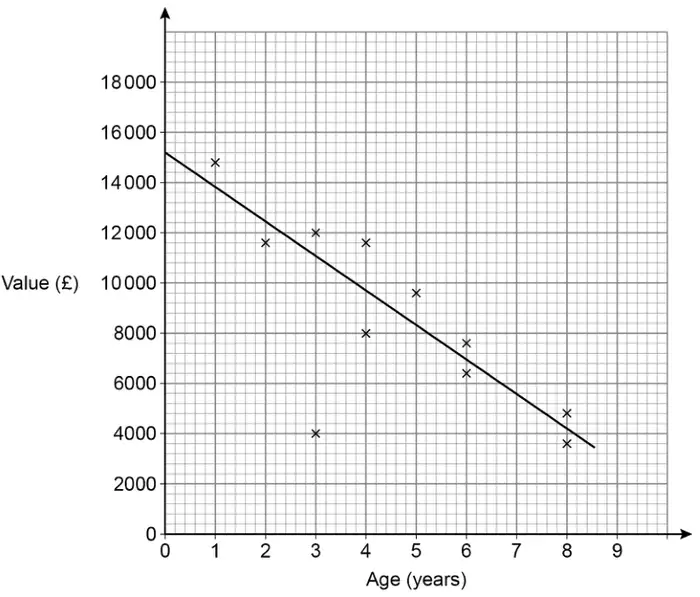
25 The scatter graph shows information about the age and the price of each of 12 cars of the same model.
(a) Describe the relationship between the age of a car and its price. (1)
A different car of the same model is \(3\tfrac{1}{2}\) years old.
(b) Estimate the price of this car. (2)
Mark scheme (a)
Answer
Mark
Notes
Relationship
1
B1 for a description of a dynamic relationship eg “The older the car the lower the price” or “The newer the car the greater the price” oe (accept negative correlation)
Mark scheme (b)
Answer
Mark
Notes
6400 to 7000
2
B2 for an answer in the range 6400 to 7000
OR
M1 for a single straight line segment with negative gradient that could be used as a line of best fit or vert. line from 3.5 or a point plotted at (3.5, \(y\)), \(y\) in the range 6400 to 7000 A1 for 6400 to 7000
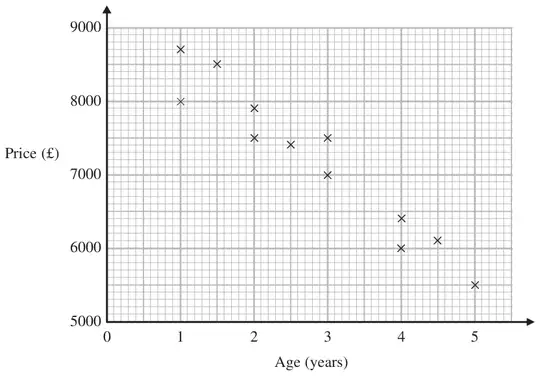
6 The scatter graph shows information about the age and the price of each of 12 cars of the same model.
(a) Describe the relationship between the age of a car and its price. (1)
A different car of the same model is \(3\tfrac{1}{2}\) years old.
(b) Estimate the price of this car. (2)
Mark scheme (a)
Answer
Mark
Notes
Relationship
1
B1 for a description of a dynamic relationship eg “The older the car the lower the price” or “The newer the car the greater the price” oe (accept negative correlation)
Mark scheme (b)
Answer
Mark
Notes
6400 to 7000
2
M1 for a single straight line segment with negative gradient that could be used as a line of best fit or vert. line from 3.5 or a point plotted at \((3.5, y)\), where \(y\) is in the range 6400 to 7000 A1 for 6400 - 7000
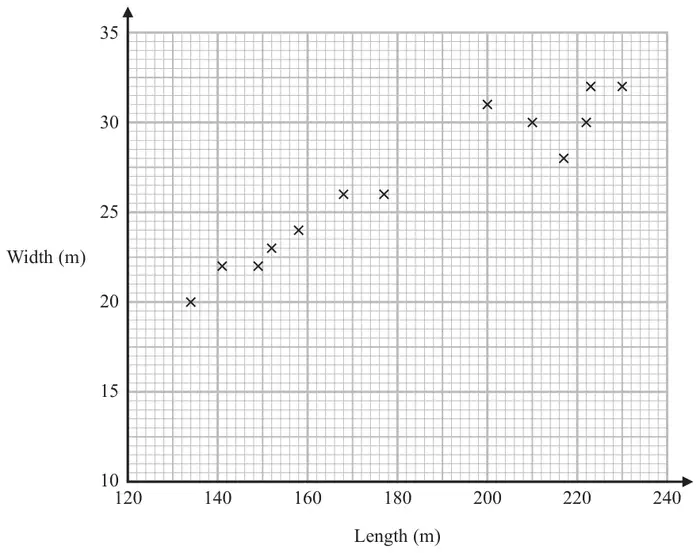
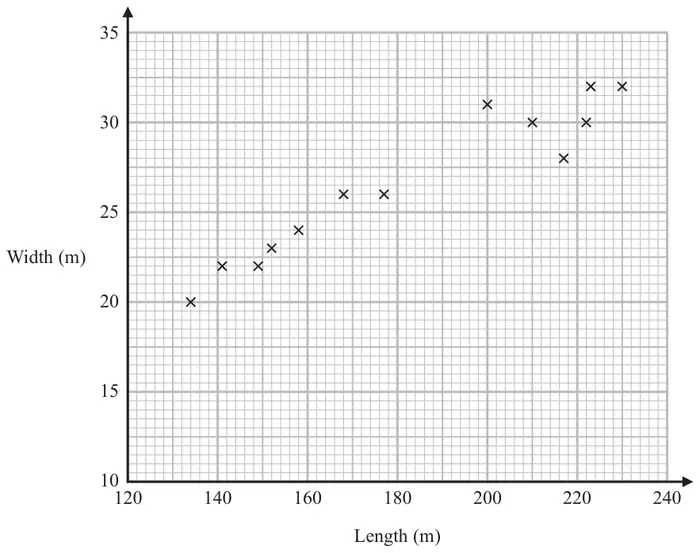
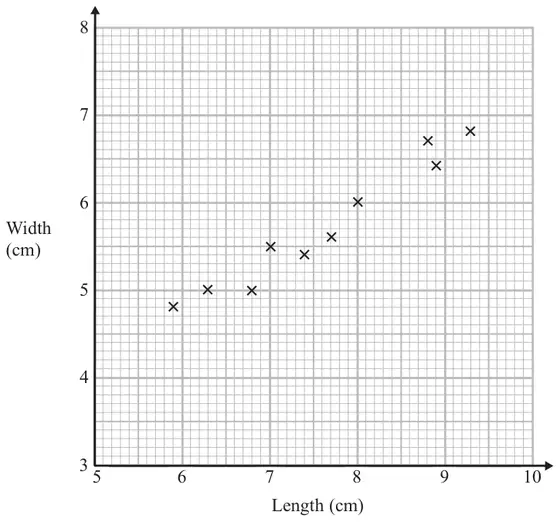
21 The scatter graph shows some information about ten pine cones from the same tree. It shows the length and the width of each pine cone.
(a) Describe the relationship between the length and the width of a pine cone. (1)
Another pine cone from this tree has a length of 8.4 cm.
(b) Estimate the width of this pine cone. (2)
Mark scheme (a)
Answer
Mark
Notes
Relationship
1
B1 for description of relationship eg “As the length of the pine cone increases the width increases” oe (accept positive correlation)
Mark scheme (b)
Answer
Mark
Notes
6.1 to 6.4
2
M1 for a single straight line segment with positive gradient that could be used as a line of best fit or a vertical line from 8.4 or a point at (8.4, \(y\)) where \(y\) is from 6.1 to 6.4 A1 for given answer in the range 6.1 to 6.4
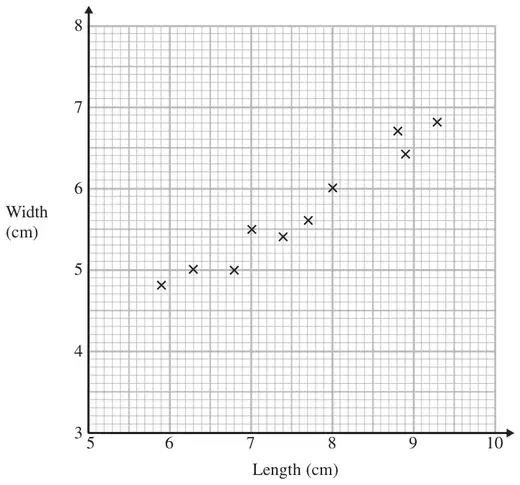
2 The scatter graph shows some information about ten pine cones from the same tree. It shows the length and the width of each pine cone.
(a) Describe the relationship between the length and the width of a pine cone. (1)
Another pine cone from this tree has a length of 8.4 cm.
(b) Estimate the width of this pine cone. (2)
Mark scheme (a)
Answer
Mark
Notes
Relationship
1
B1 for description of relationship eg “As the length of the pine cone increases the width increases” oe (accept positive correlation)
Mark scheme (b)
Answer
Mark
Notes
6.1 to 6.4
2
M1 for a single straight line segment with positive gradient that could be used as a line of best fit or a vertical line from 8.4 or a point at \((8.4, y)\) where \(y\) is from 6.1 to 6.4 A1 for given answer in the range 6.1 to 6.4
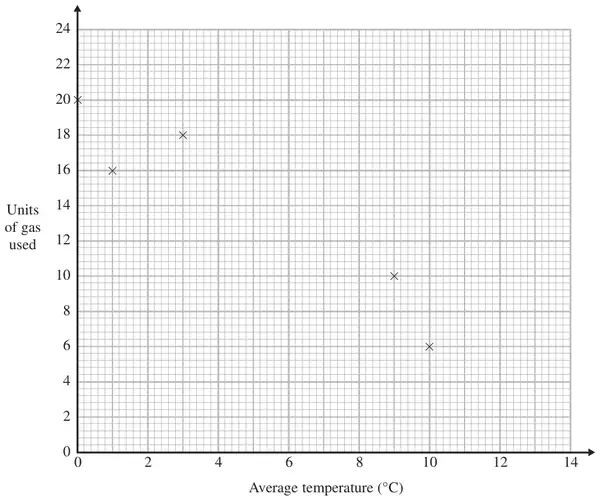
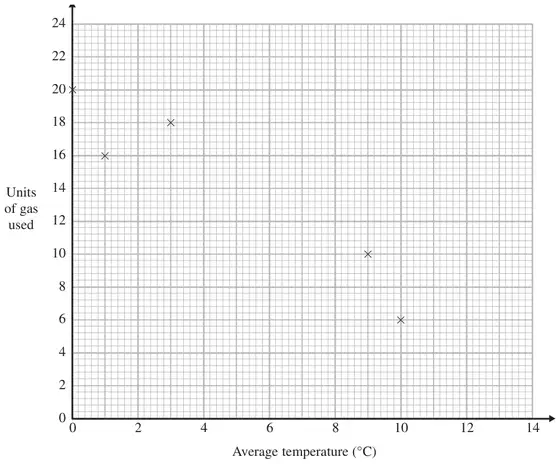
25 The table shows the average temperature on each of seven days and the number of units of gas used to heat a house on these days.
Average temperature (\(^\circ\)C)
0
1
3
9
10
12
13
Units of gas used
20
16
18
10
6
6
2
(a) Complete the scatter graph to show the information in the table. The first 5 points have been plotted for you. (1)
(b) Describe the relationship between the average temperature and the number of units of gas used. (1)
(c) Estimate the average temperature on a day when 12 units of gas are used. (2)
Mark scheme (a)
Answer
Mark
Notes
Points plotted
1
B1 for points plotted at (12, 6) and (13, 2)
Mark scheme (b)
Answer
Mark
Notes
Description
1
B1 for description; e.g. as the temperature goes up the number of units of gas used goes down oe accept negative correlation.
Mark scheme (c)
Answer
Mark
Notes
5 – 7
2
M1 for use of graph e.g. a single straight line segment with negative gradient that could be used as a line of best fit or an indication on the diagram from 12 on the y axis. A1 for 5 – 7
2 The table shows the average temperature on each of seven days and the number of units of gas used to heat a house on these days.
Average temperature (°C)
0
1
3
9
10
12
13
Units of gas used
20
16
18
10
6
6
2
(a) Complete the scatter graph to show the information in the table. The first 5 points have been plotted for you. (1)
(b) Describe the relationship between the average temperature and the number of units of gas used. (1)
(c) Estimate the average temperature on a day when 12 units of gas are used. (2)
Mark scheme (a)
Answer
Mark
Notes
Points plotted
1
B1 for points plotted at (12, 6) and (13, 2)
Mark scheme (b)
Answer
Mark
Notes
Description
1
B1 for description; accept negative correlation.
Mark scheme (c)
Answer
Mark
Notes
5 – 7
2
M1 for evidence of use of graph eg a single straight line segment with negative gradient that could be used as a line of best fit or an indication on the diagram from 12 on the \(y\) axis. A1 for 5 – 7
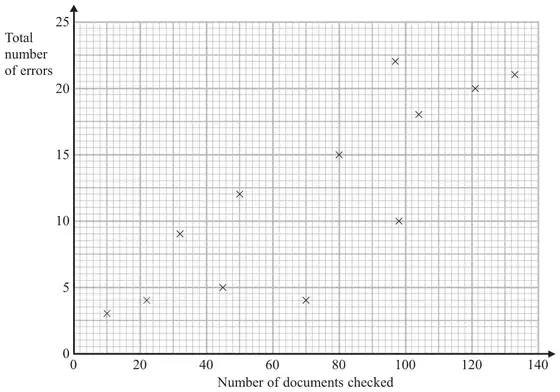
2 A publisher checks documents for errors. He records the number of documents that are checked each day. He also records the total number of errors in the documents each day.
The scatter graph shows this information.
On another day 90 documents are checked. There is a total of 17 errors.
(a) Show this information on the scatter graph. (1)
(b) Describe the correlation between the number of documents checked and the total number of errors. (1)
One day 110 documents are checked.
(c) Estimate the total number of errors in these documents. (2)
Mark scheme (a)
Answer
Mark
Notes
Plot (90,17)
1
B1 cao
Mark scheme (b)
Answer
Mark
Notes
Positive
1
B1 Positive
Mark scheme (c)
Answer
Mark
Notes
In range 16 to 20
2
M1 for a single straight line segment with positive gradient that could be used as a line of best fit or a vertical line from 110 or a point plotted at (110, \(y\)) where \(y\) is in the range 16 to 20 A1 for an answer in the range 16 to 20 inclusive
3 The scatter graph shows some information about 10 cars, of the same type and make. The graph shows the age (years) and the value (£) of each car.
The table shows the age and the value of two other cars of the same type and make.
age (years)
1
3.5
value (£)
8200
5000
(a) On the scatter graph, plot the information from the table. (1)
(b) Describe the relationship between the age and the value of the cars. (1)
A car of the same type and make is \(2\frac{1}{2}\) years old.
(c) Estimate the value of the car. (2)
Mark scheme (a)
Answer
Mark
Notes
Points plotted at (1,8200) and (3.5,5000)
1
B1 for points accurately plotted ±1/2 square tolerance
Mark scheme (b)
Answer
Mark
Notes
‘the older the car the lower the value’ ‘the greater the value the newer the car’
1
B1 for an acceptable relationship eg. ‘the older the car the lower the value’ (accept ‘negative correlation’ but not just ‘negative’)
Mark scheme (c)
Answer
Mark
Notes
5200 to 6600
2
M1 for a single line segment with negative gradient that could be used as a line of best fit or a vertical line from 2.5 or a point at (2.5,\(y\)) where \(y\) is from 5200 to 6600 A1 for given answer in the range 5200 − 6600
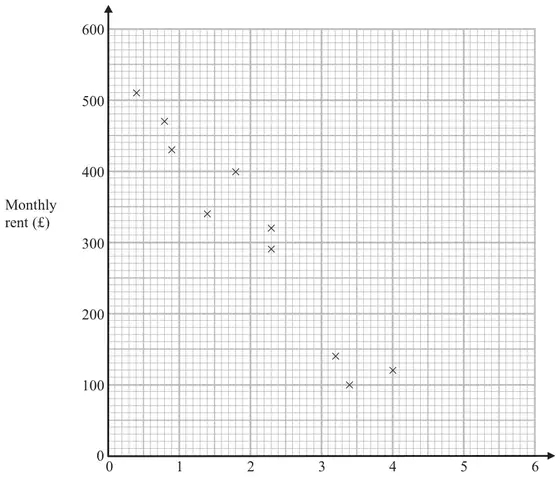
2 The scatter graph shows information about 10 apartments in a city.
The graph shows the distance from the city centre and the monthly rent of each apartment.
The table shows the distance from the city centre and the monthly rent for two other apartments.
Distance from the city centre (km)
2
3.1
Monthly rent (£)
250
190
(a) On the scatter graph, plot the information from the table. (1)
(b) Describe the relationship between the distance from the city centre and the monthly rent. (1)
An apartment is 2.8 km from the city centre.
(c) Find an estimate for the monthly rent for this apartment. (2)
Mark scheme (a)
Answer
Mark
Notes
Plot points
1
Plot (2, 250) and (3.1, 190) B1 for both points plotted accurately
Mark scheme (b)
Answer
Mark
Notes
Relationship
1
B1 for “As the distance from the centre increases the monthly rent decreases” or the nearer you are to the centre the more you have to pay oe (accept negative correlation)
Mark scheme (c)
Answer
Mark
Notes
200 to 260
2
M1 for attempting a correct method, eg a line of best fit or any other indication, on a line that could be used as a line of best fit eg line to graph at \(x = 2.8\) or a mark on the line at 2.8 A1 for value in the range 200 to 260
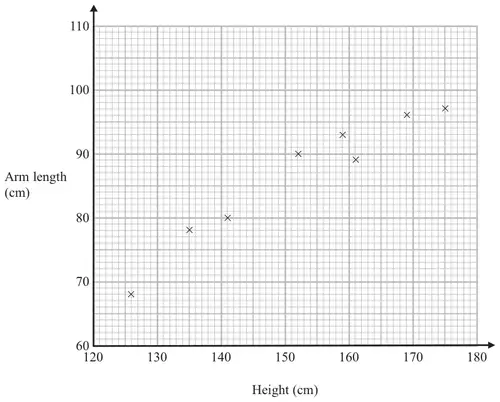
24 The scatter graph shows information about the height and the arm length of each of 8 students in Year 11
(a) What type of correlation does this scatter graph show? (1)
A different student in Year 11 has a height of 148 cm.
(b) Estimate the arm length of this student. cm (2)
Mark scheme (a)
Answer
Mark
Notes
Positive (correlation)
1
B1 for positive (correlation) [do not accept a relationship]
Mark scheme (b)
Answer
Mark
Notes
83 to 87 inc.
2
B2 for an answer in the range 83 to 87 inc. OR M1 for a single straight line segment with positive gradient that could be used as a line of best fit or for an indication on the diagram from 148 on the height axis A1 ft from their line of best fit
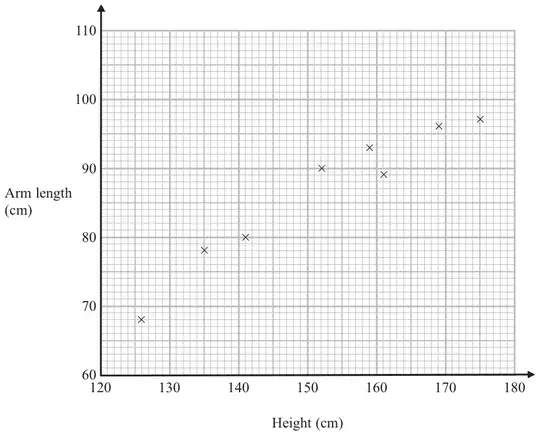
2 The scatter graph shows information about the height and the arm length of each of 8 students in Year 11
(a) What type of correlation does this scatter graph show? (1)
A different student in Year 11 has a height of 148 cm.
(b) Estimate the arm length of this student. (2)
Mark scheme (a)
Answer
Mark
Notes
Positive (correlation)
1
B1 for positive (correlation) [do not accept a relationship]
Mark scheme (b)
Answer
Mark
Notes
85
2
B2 for an answer in the range 83 to 87 OR M1 for a single straight line segment with positive gradient that could be used as a line of best fit or for an indication on the diagram from 148 on the height axis A1 ft from their line of best fit
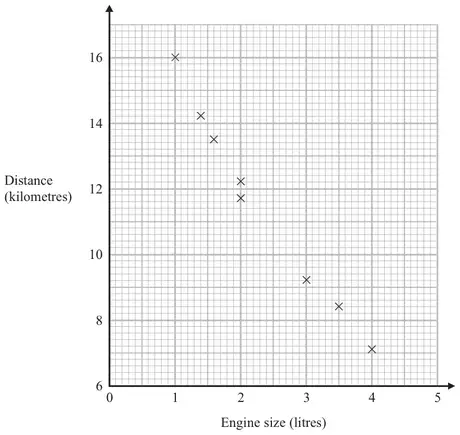
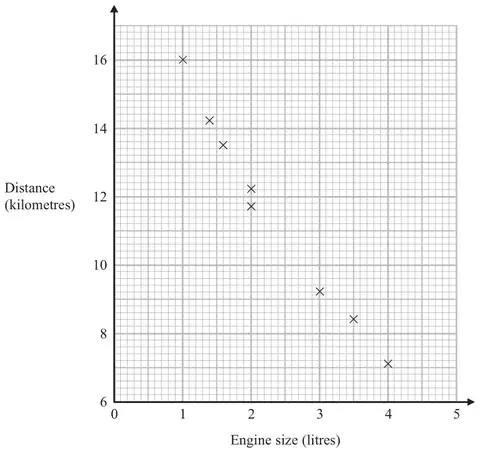
26 The scatter graph shows some information about 8 cars. For each car it shows the engine size, in litres, and the distance, in kilometres, the car travels on one litre of petrol.
(a) What type of correlation does the scatter graph show? (1)
A different car of the same type has an engine size of 2.5 litres.
(b) Estimate the distance travelled on one litre of petrol by this car. kilometres (2)
Mark scheme (a)
Answer
Mark
Notes
negative
1
B1 for negative
Mark scheme (b)
Answer
Mark
Notes
10.3 - 11.7
2
M1 for a single straight line segment with negative gradient that could be used as a line of best fit or an indication on the diagram from 2.5 on the \(x\) axis A1 for an answer in the range 10.3 – 11.7 inclusive
7 The scatter graph shows some information about 8 cars.
For each car it shows the engine size, in litres, and the distance, in kilometres, the car travels on one litre of petrol.
(a) What type of correlation does the scatter graph show? (1)
A different car of the same type has an engine size of 2.5 litres.
(b) Estimate the distance travelled on one litre of petrol by this car. (2)
Mark scheme (a)
Answer
Mark
Notes
negative
1
B1 for negative
Mark scheme (b)
Answer
Mark
Notes
10.3 – 11.7
2
M1 for a single straight line segment with negative gradient that could be used as a line of best fit or an indication on the diagram from 2.5 on the x axis A1 for an answer in the range 10.3 – 11.7 inclusive
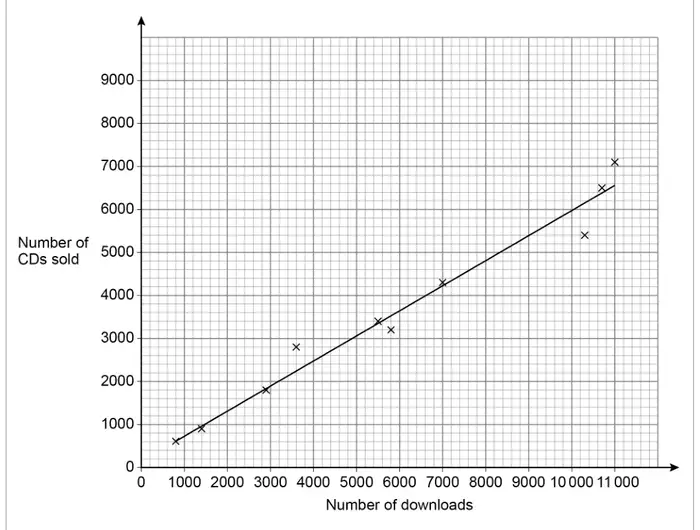
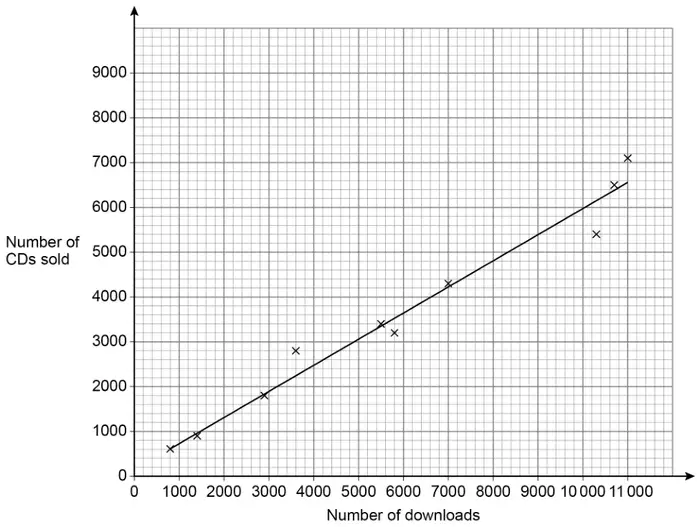
the number of downloads on the first day and the number of CDs sold on the first day.
A line of best fit has been drawn on the scatter graph.
(a) The scatter graph shows positive correlation.
Describe the relationship between number of downloads and number of CDs sold. [1 mark]
(b) The company earns
£2.50 for each download and £3 for each CD sold.
The company releases another album.
On the first day it has 9000 downloads.
Estimate the total amount the company earns from downloads and CDs of the album that day. [3 marks]
Mark scheme (a)
Answer
Mark
Comments
Valid description
B1
eg as downloads increase, so do CD sales downloads are about \(\left[1\dfrac{1}{3},\ 2\right]\) times as many as CDs CDs are about \(\left[\dfrac{1}{2},\ \dfrac{3}{4}\right]\) as many as downloads
Additional guidance
Ignore ‘Positive correlation’
Condone references to causality eg an increase in downloads causes an increase in CDs sold
B1
As one goes up the other goes up / Both go up at a similar rate
the number of downloads on the first day and the number of CDs sold on the first day.
A line of best fit has been drawn on the scatter graph.
(a) The scatter graph shows positive correlation.
Describe the relationship between number of downloads and number of CDs sold. [1 mark]
(b) The company earns
£2.50 for each download and £3 for each CD sold.
The company releases another album.
On the first day it has 9000 downloads.
Estimate the total amount the company earns from downloads and CDs of the album that day. [3 marks]
Mark scheme (a)
Answer
Mark
Comments
Valid description
B1
eg as downloads increase, so do CD sales downloads are about \(\left[1\dfrac{1}{3}, 2\right]\) times as many as CDs CDs are about \(\left[\dfrac{1}{2}, \dfrac{3}{4}\right]\) as many as downloads
Additional guidance
Ignore ‘Positive correlation’
Condone references to causality eg an increase in downloads causes an increase in CDs sold
B1
As one goes up the other goes up / Both go up at a similar rate
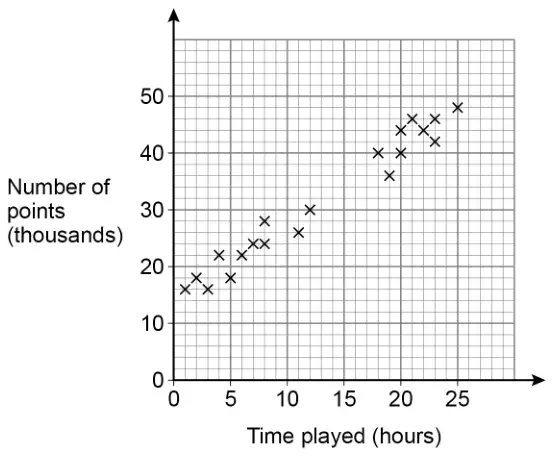
The scatter graph shows the time played and the points scored by some players.
(a) Circle the strength and type of correlation shown. [1 mark]
weak positive
strong positive
weak negative
strong negative
(b) Players get one extra life for every 2000 points they score.
Jonah plays the game for 15 hours.
Use a line of best fit to estimate the number of extra lives he gets. [3 marks]
Mark scheme (a)
Answer
Mark
Comments
Strong positive
B1
Mark scheme (b)
Answer
Mark
Comments
Straight line of best fit passing through (5, [18k, 24k]) and (23, [42k, 48k]
B1
mark intention of straight line ignore anything beyond gates
Correct reading \(\pm\dfrac{1}{2}\) square for their straight line of best fit
B1ft
ft their straight line with positive gradient ignore any working lines on the graph condone thousands missing may be implied by correct number of lives for their line
Correct evaluation of their answer in thousands divided by 2000
B1ft
ft their reading from straight line but must be in thousands condone half a life (or rounded or truncated) if reading is an odd number of thousands
Additional guidance
(their correct line of best fit would give a reading of 34 000) Answer 17 Answer 0.017 (Points =) 33 000, answer 16 (within half a square, answer truncated) (Points =) 32 000, answer 16
B1B1B1 B1B1B0 B1B1B1 B1B0B1ft
For two lines of best fit with no answer, take as choice
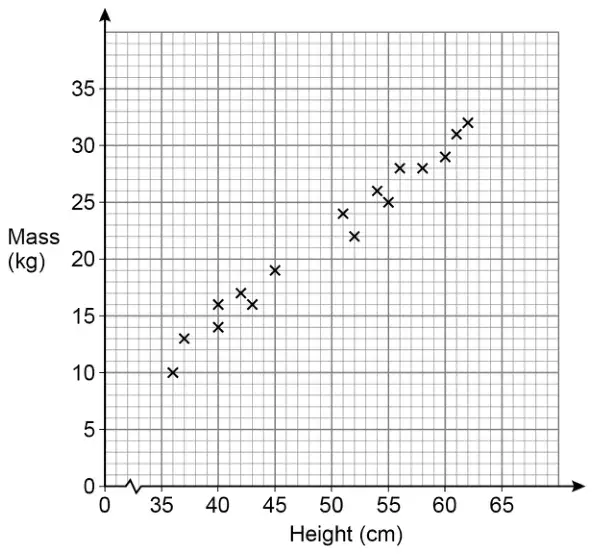
21 The scatter graph shows the height and mass of some dogs.
(a) The scatter graph shows positive correlation.
Describe the relationship between the height and mass of the dogs. [1 mark]
(b) Use a line of best fit to estimate the mass of a dog with height 48 cm [2 marks]
Mark scheme (a)
Answer
Mark
Comments
Valid description
B1
eg as height increases so does mass or as mass decreases so does height
Additional guidance
Ignore incorrect or irrelevant statements alongside correct statements, unless contradictory
As one increases so does the other
B1
It is usually heavier the taller it is
B1
As height increases the weight increases
B1
They are directly proportional (condone)
B1
It is positive correlation because the taller the dogs the heavier the dogs
B1
The taller they are the more they weigh
B1
Taller dogs are heavier
B1
The tallest dogs have more mass than the shorter dogs
B1
The shortest dogs have a lower mass
B1
Mass and height both increase at the same time (condone)
B1
The height and mass of the dogs increase at the same rate (condone)
B1
A tall dog is heavy
B0
The bigger they are the more they weigh (height is not implied from bigger)
B0
It is heavier as it grows (height is not implied from growth)
B0
It is positive correlation
B0
Mark scheme (b)
Answer
Mark
Comments
Straight line passing through (36, [9, 13]) and (62, [30, 34])
B1
accept intention to draw a straight line ignore anything outside (36, [9, 13]) and (62, [30, 34])
Correct reading \(\pm\dfrac{1}{2}\) square for their straight line
B1ft
ft their line with positive gradient ignore any working lines on their graph
Additional guidance
No line of best fit
B0B0
Short straight line not passing through (36, [9, 13]) and (62, [30, 34]) with positive gradient and correct reading \(\pm\dfrac{1}{2}\) square for their line
B0B1ft
Two lines of best fit, mark the line that leads to their answer
Two lines of best fit, no answer, apply the usual rules of choice
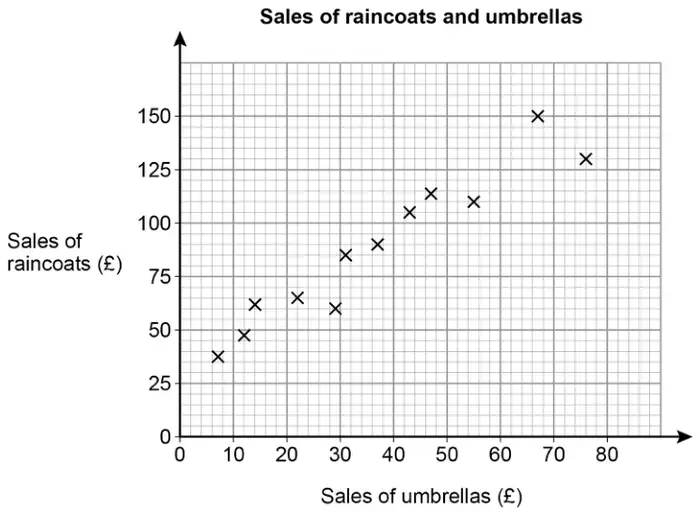
The scatter graph shows the monthly sales for 12 months.
(a) Write down the type of correlation shown by the graph. [1 mark]
(b) The manager expects the sales of umbrellas next month to be £60
Draw a line of best fit to estimate the sales of raincoats next month. [3 marks]
Mark scheme (a)
Answer
Mark
Comments
Positive
B1
Additional guidance
Ignore descriptive words such as ‘strong’ or ‘weak’ or ‘scattered’
Mark scheme (b)
Answer
Mark
Comments
Correct straight line which passes between (10, 35) and (10, 55) and between (70, 135) and (70, 155)
B1
line must extend from 10 to 70
Draws a vertical line from umbrella sales of £60 to meet their line or marks a point on their line of best fit corresponding to umbrella sales of £60
M1
their line / curve must be increasing may be implied by correct value for their line / curve
Correct value for their line
A1ft
ft their increasing line / curve allow any reading within one vertical square eg if their vertical line crosses their line of best fit in the first square above 125, allow [125, 130]
Additional guidance
No increasing line / curve drawn
B0M0A0
Mark intention for straight line for B1
The line may go through the coordinates of the gates but must not go above or below
Ignore any parts of the line outside the range 10 to 70
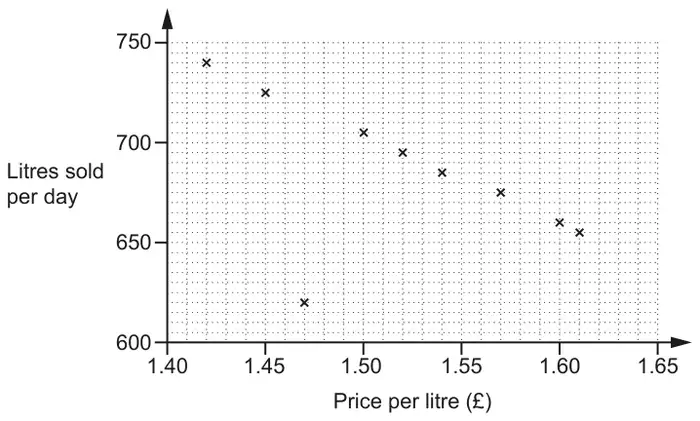
19 Each week the manager of a petrol station records the average daily sales, in litres, and the average price, in pounds, of a litre of petrol for that week.
The table shows their results for ten weeks.
Week
1
2
3
4
5
6
7
8
9
10
Price per litre (£)
1.42
1.45
1.47
1.50
1.54
1.60
1.57
1.52
1.61
1.46
Litres sold per day
740
725
620
705
685
660
675
695
655
715
The results for the first nine weeks are plotted on the scatter diagram.
(a) Plot the result for week 10. [1]
(b) Describe the type of correlation shown in the scatter diagram. [1]
(c) In one week, there was a delay with petrol deliveries.
Circle the most likely point on the scatter diagram for that week. [1]
(d)
(i) On the scatter diagram, draw a line of best fit. [1]
(ii) Use the line of best fit to estimate the average daily sales when the price per litre of petrol is £1.48. [1]
(e) The manager says,
As the sales go down, the total amount of money we take stays roughly the same.
Find evidence to support this statement. [3]
Mark scheme (a)
Answer
Marks
Part marks and guidance
(1.46, 715) accurately plotted
1
Tolerance: no daylight between their point and correct point
Mark scheme (b)
Answer
Marks
Part marks and guidance
Negative
1
Ignore embellishments
Mark scheme (c)
Answer
Marks
Part marks and guidance
(1.47, 620) ringed
1
Allow any indication
Mark scheme (d)
Answer
Marks
Part marks and guidance
(i) Accurate line of best fit
1
See overlay, between (1.44, 720) and (1.44, 740) and between (1.60, 650) and (1.60, 670) and must reach vertical lines at each end, ignore beyond overlay
(ii) FTtheir line
1FT
FTtheir line with negative gradient only
tolerance: our reading \(\pm\) 3
Mark scheme (e)
Answer
Marks
Part marks and guidance
Two different products correctly calculated, one product in the range \(1.40 \leqslant\) price \(\leqslant 1.52\) and one product in the range \(1.52 <\) price \(\leqslant 1.65\)
3
B2 for one product correctly calculated or B1 for one product calculated with the incorrect result
see appendix for the products, the points used must be either the given points or on their lobf not the outlier, if there are more than two products then select the best two
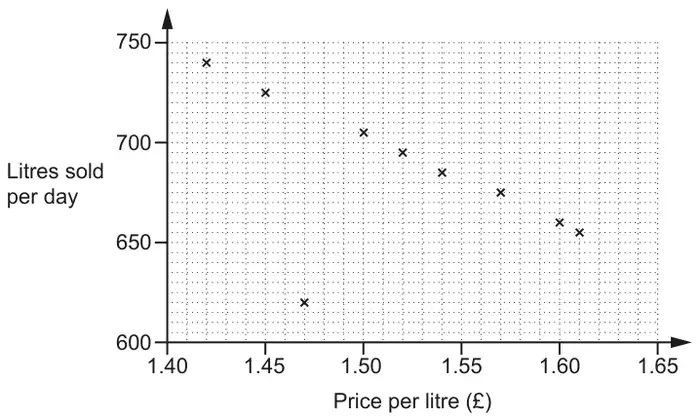
4 Each week the manager of a petrol station records the average daily sales, in litres, and the average price, in pounds, of a litre of petrol for that week.
The table shows their results for ten weeks.
Week
1
2
3
4
5
6
7
8
9
10
Price per litre (£)
1.42
1.45
1.47
1.50
1.54
1.60
1.57
1.52
1.61
1.46
Litres sold per day
740
725
620
705
685
660
675
695
655
715
The results for the first nine weeks are plotted on the scatter diagram.
(a) Plot the result for week 10. [1]
(b) Describe the type of correlation shown in the scatter diagram. [1]
(c) In one week, there was a delay with petrol deliveries.
Circle the most likely point on the scatter diagram for that week. [1]
(d)
(i) On the scatter diagram, draw a line of best fit. [1]
(ii) Use the line of best fit to estimate the average daily sales when the price per litre of petrol is £1.48. [1]
(e) The manager says,
As the sales go down, the total amount of money we take stays roughly the same.
Find evidence to support this statement. [3]
Mark scheme (a)
Answer
Marks
Part marks and guidance
(1.46, 715) accurately plotted
1
Tolerance : no daylight between their point and correct point
Mark scheme (b)
Answer
Marks
Part marks and guidance
Negative
1
Ignore embellishments
Mark scheme (c)
Answer
Marks
Part marks and guidance
(1.47, 620) ringed
1
allow any indication
Mark scheme (d)
Answer
Marks
Part marks and guidance
(i) Accurate line of best fit
1
see overlay between (1.44, 720) and (1.44, 740) and between (1.60, 650) and (1.60, 670) and must reach vertical lines at each end, ignore beyond overlay
(ii) FTtheir line
1FT
FTtheir line with negative gradient only
tolerance : our reading ± 3
Mark scheme (e)
Answer
Marks
Part marks and guidance
Two different products correctly calculated, one product in the range 1.40 ≤ price ≤ 1.52 and one product in the range 1.52 < price ≤ 1.65
3
B2 for one product correctly calculated or B1 for one product calculated with the incorrect result
see appendix for the products, the points used must be either the given points or on their lobf not the outlier, if there are more than two products then select the best two
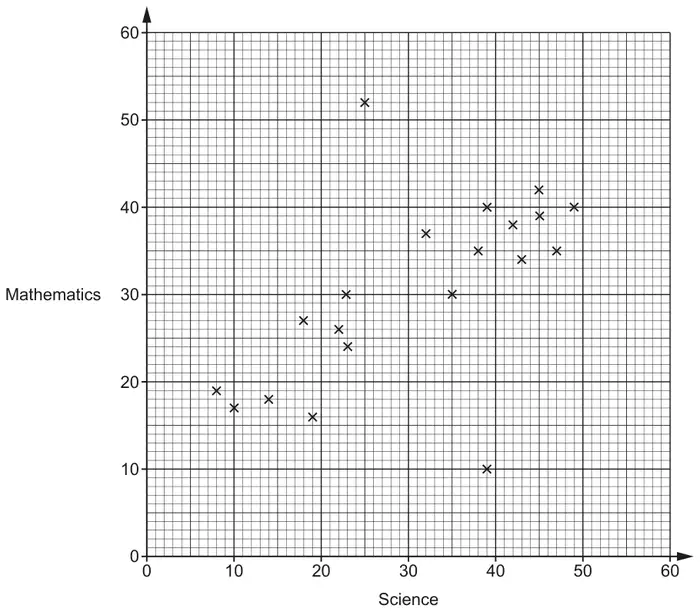
22 The scatter diagram shows the test scores for 20 pupils in Science and Mathematics.
(a) Describe the type of correlation shown in the scatter diagram. [1]
(b) One pupil took the Science test but was then ill during the Mathematics test and had to leave early.
On the scatter diagram, circle the point that is most likely to represent this pupil. [1]
(c) By drawing a line of best fit, estimate the test score in Mathematics for a pupil who scored 28 in the Science test. [2]
(d) Explain why using the scatter diagram to estimate the test score in Mathematics for a pupil who scored 60 in Science may be unreliable. [1]
(e) Find the percentage of the 20 pupils who scored less than 30 marks in both Science and Mathematics. [3]
Mark scheme (a)
Answer
Marks
Part marks and guidance
Positive
1
Ignore embellishments
Mark scheme (b)
Answer
Marks
Part marks and guidance
Indicates the point (39, 10)
1
Ignore circles around the points \(\leqslant\) 30 for both Science and Maths as this working is for part (e)
Mark scheme (c)
Answer
Marks
Part marks and guidance
Ruled line of best fit
and
answer FT \(\pm\) 0.5 their straight ruled line at 28 Science marks
2
B1 for ruled line of best fit or answer FT \(\pm\) 0.5 their straight ruled line with positive gradient
Use overlay for LOBF, ruled line needs to reach both gates set at: (8,11) and (8,22) (49,35) and (49,46) Gates include circles on overlay Ignore LOBF beyond gates
Mark scheme (d)
Answer
Marks
Part marks and guidance
Correct explanation e.g. It is beyond the range of the data provided on the scatter diagram.
The pupil may not follow the trend/pattern of the data
1
Accept The line of best fit should not extend beyond the data provided Outside range of data provided oe Small sample Data only goes up to 49 No one scores 60
Do not Accept You cannot extend past the LOBF otherwise it is inaccurate
Ignore incorrect statements See Appendix 3
Appendix
APPENDIX 3 Question 22(d)
Response
Mark
1
It is extrapolated and not in the data provided
1
2
The diagram has no data above 49 (underlined part gets the mark) (accept range 49 to 59 for this type of statement)
1
3
The graph does not go up to 60 as there is no data above 49 (underlined part gets the mark)
1
4
We do not know that the pattern will continue above 49 (implies trend may not continue)
1
5
The graph does not cover that data range (allow for the underlined part)
1
6
There are no pupils on the graph with scores above 49 (accept pupils oe for data) (accept range 49 to 59 for this type of statement)
1
7
There are no plots/points/results on the graph above 49 (accept plots/points/results for data) (accept range 49 to 59)
1
8
Most pupils scored between 20 and 50 in Science – we cannot predict accurately for 60 marks
1
9
They may be much better at one subject than the other and do not follow the correlation (allow for the underlined part with ‘may’)
1
10
There is no data above 50 [for Science] (accept range 49 to 59 for this type of statement)
1
11
It may be an outlier (Implies it may not follow the pattern)
1
12
It is too far away from the last piece of data
1
13
There is insufficient data (implies small sample)
1
14
The graph reaches up to 49 (not referring to data)
0
15
The scatter graph does not go beyond 50 (not referring to data)
0
16
Extrapolated (needs explanation)
0
17
The graph only goes up to 49 (not referring to data)
0
18
The graph does not show information for a score of 60
0
19
There is no data
0
20
They might be better at Maths than Science
0
21
It is an outlier (It is not an outlier – we do not know – needs to be phrased like example 11)
0
22
Because there is no results
0
Mark scheme (e)
Answer
Marks
Part marks and guidance
35[%]
3
M2 for \(\frac{7}{20} \times 100\) oe or B1 for 7 [pupils]
If 0 scored, SC1 for \(\dfrac{\textit{their}\,7}{20}\) correctly converted to a percentage.
B1 implied by \(\frac{7}{20}\) oe or \(\frac{7}{k}\) \((k \gt 7)\)
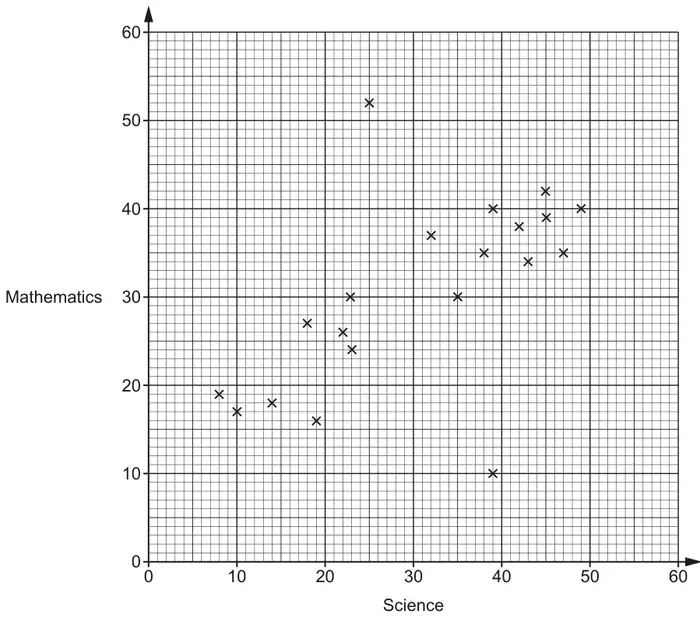
4 The scatter diagram shows the test scores for 20 pupils in Science and Mathematics.
(a) Describe the type of correlation shown in the scatter diagram. [1]
(b) One pupil took the Science test but was then ill during the Mathematics test and had to leave early.
On the scatter diagram, circle the point that is most likely to represent this pupil. [1]
(c) By drawing a line of best fit, estimate the test score in Mathematics for a pupil who scored 28 in the Science test. [2]
(d) Explain why using the scatter diagram to estimate the test score in Mathematics for a pupil who scored 60 in Science may be unreliable. [1]
(e) Find the percentage of the 20 pupils who scored less than 30 marks in both Science and Mathematics. [3]
Mark scheme (a)
Answer
Marks
Part marks and guidance
Positive
1
Ignore embellishments
Mark scheme (b)
Answer
Marks
Part marks and guidance
Indicates the point (39, 10)
1
Ignore circles around the points \(\leqslant 30\) for both Science and Maths as this is working for part (e)
Mark scheme (c)
Answer
Marks
Part marks and guidance
Ruled line of best fit
and
answer FT ± 0.5 their straight ruled line at 28 Science marks
2
B1 for ruled line of best fit or answer FT ± 0.5 their straight ruled line with positive gradient
Use overlay for LOBF, ruled line needs to reach both gates set at: (8,11) and (8,22) (49,35) and (49,46) Gates include circles on overlay Ignore LOBF beyond gates
Mark scheme (d)
Answer
Marks
Part marks and guidance
Correct explanation e.g. It is beyond the range of the data provided on the scatter diagram.
The pupil may not follow the trend/pattern of the data
1
Accept The line of best fit should not extend beyond the data provided Outside range of data provided oe Small sample Data only goes up to 49 No one scores 60
Do not Accept You cannot extend past the LOBF otherwise it is inaccurate
Ignore incorrect statements See Appendix 2
Appendix 2: Question 4(d)
Response
Mark
1
It is extrapolated and not in the data provided
1
2
The diagram has no data above 49 (underlined part gets the mark) (accept range 49 to 59 for this type of statement)
1
3
The graph does not go up to 60 as there is no data above 49 (underlined part gets the mark)
1
4
We do not know that the pattern will continue above 49 (implies trend may not continue)
1
5
The graph does not cover that data range (allow for the underlined part)
1
6
There are no pupils on the graph with scores above 49 (accept pupils oe for data) (accept range 49 to 59 for this type of statement)
1
7
There are no plots/points/results on the graph above 49 (accept plots/points/results for data) (accept range 49 to 59)
1
8
Most pupils scored between 20 and 50 in Science – we cannot predict accurately for 60 marks
1
9
They may be much better at one subject than the other and do not follow the correlation (allow for the underlined part with ‘may’)
1
10
There is no data above 50 [for Science] (accept range 49 to 59 for this type of statement)
1
11
It may be an outlier (Implies it may not follow the pattern)
1
12
It is too far away from the last piece of data
1
13
There is insufficient data (implies small sample)
1
14
The graph reaches up to 49 (not referring to data)
0
15
The scattergraph does not go beyond 50 (not referring to data)
0
16
Extrapolated (needs explanation)
0
17
The graph only goes up to 49 (not referring to data)
0
18
The graph does not show information for a score of 60
0
19
There is no data
0
20
They might be better at Maths than Science
0
21
It is an outlier (It is not an outlier – we do not know – needs to be phrased like example 11)
0
22
The highest Maths score was 49 and the highest Science score was 52 (Science is 49 and Maths 52 so incorrect)
0
23
Because there is no results
0
Mark scheme (e)
Answer
Marks
Part marks and guidance
35[%]
3
M2 for \(\frac{7}{20} \times 100\) oe or B1 for 7 [pupils]
If 0 scored, SC1 for \(\frac{\textit{their}7}{20}\) correctly converted to a percentage.
B1 implied by \(\frac{7}{20}\) oe or \(\frac{7}{k}\) (\(k \gt 7\))
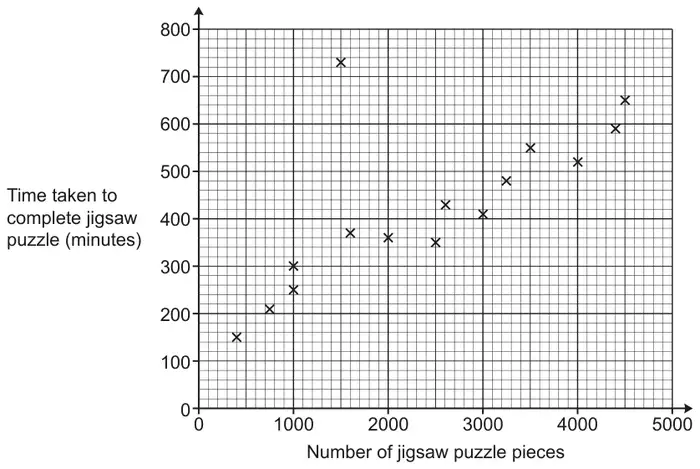
19 Beth completes some jigsaw puzzles and records the following information.
The number of pieces in the jigsaw puzzle.
The time taken to complete the jigsaw puzzle, in minutes.
Beth shows this information in a scatter diagram.
(a)
(i) Beth completes two more jigsaw puzzles.
A 3000 piece jigsaw puzzle taking 460 minutes.
A 1300 piece jigsaw puzzle taking 320 minutes.
Show this information on the scatter diagram. [1]
(ii) Describe the type of correlation shown on the scatter diagram. [1]
(b) One of Beth’s jigsaw puzzles was described as “the most difficult jigsaw puzzle you will ever try”.
(i) Circle the most likely jigsaw puzzle on the scatter diagram. [1]
(ii) Give a reason why you chose this jigsaw puzzle. [1]
(c)
(i) Draw a line of best fit on the scatter diagram. [1]
(ii) Use your line of best fit to estimate how many pieces are in a jigsaw puzzle that takes Beth 500 minutes to complete. [1]
(d) Explain why Beth should not use her scatter diagram to estimate how long it will take to complete a jigsaw puzzle containing 8000 pieces. [1]
Mark scheme (a)
Answer
Marks
Part marks and guidance
(i) Points plotted at (3000, 460) and (1300, 320)
1
Half square tolerance Use overlay as guide
(ii) Positive
1
Ignore reference to strength
Mark scheme (b)
Answer
Marks
Part marks and guidance
(i) Point at (1500, 730) circled
1
(ii) The jigsaw took a long time for a small/similar number of pieces oe
1
See appendix Must include reference to both the time taken and the number of pieces
Appendix
Question 19b(ii)
Statement
Reason
Mark
It has a small number of pieces but takes a long time to complete
1
It took the longest even though it only had 1500 pieces
Assume time
1
Because it took the most minutes even with low pieces
1
It had the most amount of time to complete
No reference to number of pieces
0
It took more time than others
No reference to number of pieces
0
It took the most amount of time for a 1500 piece puzzle
Too specific not referencing other puzzles and, thus, incorrect
0
It took the most amount of time compared to other puzzles
No reference to number of pieces. Just like saying “It took longest”
0
Most average area for this puzzle piece most average number and time taken
Garbled
0
It is furthest away from the line of best fit and the rest of the results
True depending on the line calculated/drawn but there will always be one such point and not all will be an outlier
0
Because it is not near the points towards the line
Getting there but which points are they thinking of?
0
It doesn’t fit the trend
Vague
0
It doesn’t follow the correlation of the other points
Doesn’t explain why and others could do the same
0
Mark scheme (c)
Answer
Marks
Part marks and guidance
(i) Ruled line of best fit drawn
1
Condone good freehand Line must reach between (500, 120) and (500, 220) AND (4500, 540) and (4500, 660)
(ii) Their straight line used to give number of pieces for 500 minutes
1 FT
Strict FT from their intended straight line of best fit
Tolerance ± 50 pieces (½ small square = 50 pieces) If intersection between vertical gridlines allow reading at either gridline e.g. 3340 may be 3300 or 3400 Mark to candidate’s benefit
Mark scheme (d)
Answer
Marks
Part marks and guidance
[8000 pieces is] beyond the given data oe or the trend/pattern may not continue oe
1
See appendix Do not accept “It only goes up to 5000” or “It goes off the scale” or any suggestion that the graph is not big/accurate enough Interpret “it” as reference to scale/diagram unless otherwise qualified
Appendix
Question 19d
Statement
Reason
Mark
It only goes up to 5000 and it may differ with a much larger jigsaw
First part does not score the mark but BOD second part recognises trend not continuing
1
She shouldn’t because on of (none of?) the pieces is nowhere near the other pieces so she will get it wrong.
BOD beyond the data and not referring to scale
1
8000 is beyond the range, her data only provides up to 5000 pieces
OK as references data not scale
1
Her values aren’t great enough
Not clearly saying that these are beyond data. Could be referring to scales
0
The graph doesn’t go that far
Referring to scales
0
The pieces could be easier so less time
Incorrect on all counts
0
There’s not 8000 pieces, it only goes up to 5000
It taken to be a reference to scale
0
8000 is not on the diagram
Referring to size of diagram and not range of the data
0
The data wasn’t given
Unclear, as this may mean that 8000 is not a plotted point
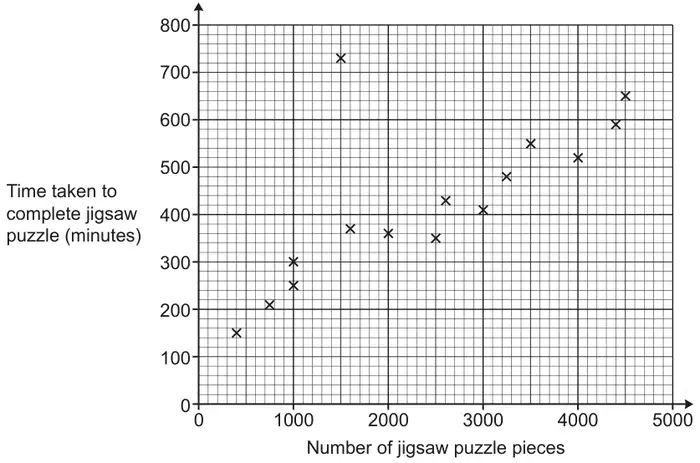
1 Beth completes some jigsaw puzzles and records the following information.
The number of pieces in the jigsaw puzzle.
The time taken to complete the jigsaw puzzle, in minutes.
Beth shows this information in a scatter diagram.
(a)
(i) Beth completes two more jigsaw puzzles.
A 3000 piece jigsaw puzzle taking 460 minutes.
A 1300 piece jigsaw puzzle taking 320 minutes.
Show this information on the scatter diagram. [1]
(ii) Describe the type of correlation shown on the scatter diagram. [1]
(b) One of Beth’s jigsaw puzzles was described as “the most difficult jigsaw puzzle you will ever try”.
(i) Circle the most likely jigsaw puzzle on the scatter diagram. [1]
(ii) Give a reason why you chose this jigsaw puzzle. [1]
(c)
(i) Draw a line of best fit on the scatter diagram. [1]
(ii) Use your line of best fit to estimate how many pieces are in a jigsaw puzzle that takes Beth 500 minutes to complete. [1]
(d) Explain why Beth should not use her scatter diagram to estimate how long it will take to complete a jigsaw puzzle containing 8000 pieces. [1]
Mark scheme (a)
Answer
Marks
Part marks and guidance
(i) Points plotted at (3000, 460) and (1300, 320)
1
Half square tolerance Use overlay as guide
(ii) Positive
1
Ignore reference to strength
Mark scheme (b)
Answer
Marks
Part marks and guidance
(i) Point at (1500, 730) circled
1
(ii) The jigsaw took a long time for a small/similar number of pieces oe
1
See appendix Must include reference to both the time taken and the number of pieces
Appendix: Question 1(b)(ii)
Statement
Reason
Mark
It has a small number of pieces but takes a long time to complete
1
It took the longest even though it only had 1500 pieces
Assume time
1
Because it took the most minutes even with low pieces
1
It had the most amount of time to complete
No reference to number of pieces
0
It took more time than others
No reference to number of pieces
0
It took the most amount of time for a 1500 piece puzzle
Too specific not referencing other puzzles and, thus, incorrect
0
It took the most amount of time compared to other puzzles
No reference to number of pieces. Just like saying “It took longest”
0
Most average area for this puzzle piece most average number and time taken
Garbled
0
It is furthest away from the line of best fit and the rest of the results
True depending on the line calculated/drawn but there will always be one such point and not all will be an outlier
0
Because it is not near the points towards the line
Getting there but which points are they thinking of?
0
It doesn’t fit the trend
Vague
0
It doesn’t follow the correlation of the other points
Doesn’t explain why and others could do the same
0
Mark scheme (c)
Answer
Marks
Part marks and guidance
(i) Ruled line of best fit drawn
1
Condone good freehand Line must reach between (500, 120) and (500, 220) AND (4500, 540) and (4500, 660) (use overlay, not cutting diagonal lines)
(ii) Their straight line used to give number of pieces for 500 minutes
1 FT
Strict FT from their intended straight line of best fit
Tolerance ± 50 pieces (½ small square = 50 pieces) If intersection between vertical gridlines allow reading at either gridline e.g. 3340 may be 3300 or 3400 Mark to candidate’s benefit
Mark scheme (d)
Answer
Marks
Part marks and guidance
[8000 pieces is] beyond the given data oe or the trend/pattern may not continue oe
1
See appendix Do not accept “It only goes up to 5000” or “It goes off the scale” or any suggestion that the graph is not big/accurate enough Interpret “it” as reference to scale/diagram unless otherwise qualified
Appendix: Question 1(d)
Statement
Reason
Mark
It only goes up to 5000 and it may differ with a much larger jigsaw
First part does not score the mark but BOD second part recognises trend not continuing
1
She shouldn’t because on of (none of?) the pieces is nowhere near the other pieces so she will get it wrong.
BOD beyond the data and not referring to scale
1
8000 is beyond the range, her data only provides up to 5000 pieces
Ok as references data not scale
1
Her values aren’t great enough
Not clearly saying that these are beyond data. Could be referring to scales
0
The graph doesn’t go that far
Referring to scales
0
The pieces could be easier so less time
Incorrect on all counts
0
There’s not 8000 pieces, it only goes up to 5000
It taken to be a reference to scale
0
8000 is not on the diagram
Referring to size of diagram and not range of the data
0
The data wasn’t given
Unclear, as this may mean that 8000 is not a plotted point
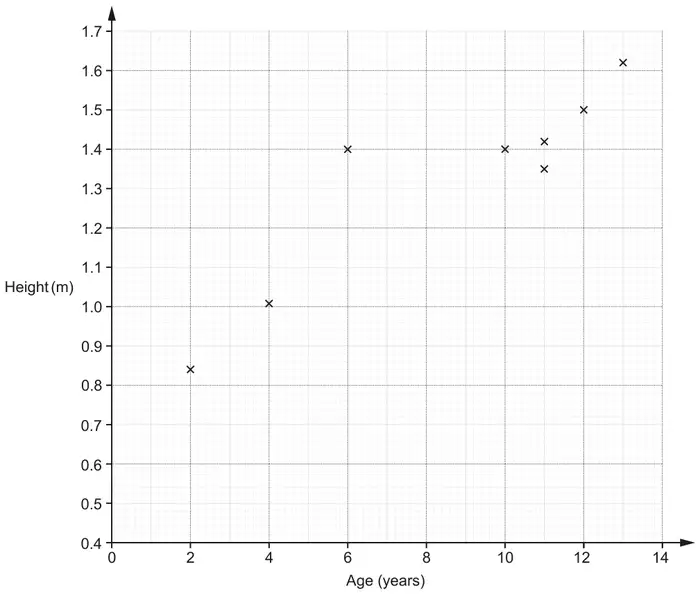
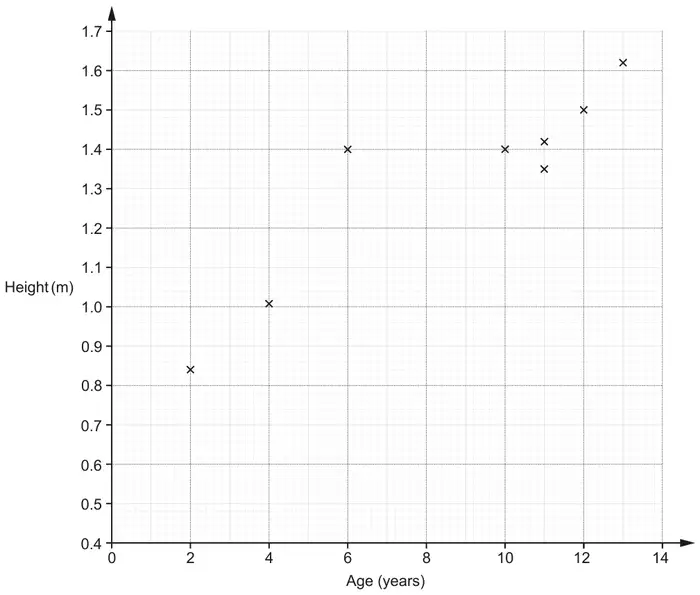
21 The table shows the ages and heights of 12 children.
The points for the first eight children (shaded in the table above) are plotted on the scatter diagram.
(a) Plot the points for the remaining four children. [2]
(b) Describe the type of correlation shown in the completed scatter diagram. [1]
(c) One of these children is taller than expected for their age.
On the scatter diagram, circle the point representing this child. [1]
(d)
(i) Kai is 8 years old. By drawing a line of best fit, estimate Kai’s height. [2]
(ii) Describe an assumption you have made in giving your answer to part (d)(i). [1]
(e) Explain why using this data to estimate the height of a child that is 17 years old may be unreliable. [1]
Mark scheme (a)
Answer
Marks
Part marks and guidance
Four correctly plotted points
2
B1 for 2 or 3 correct plots
Use overlay as a guide, \(\pm\) half small square radially
Mark scheme (b)
Answer
Marks
Part marks and guidance
Positive
1
Do not accept description of relationship Condone embellishments e.g. strong moderate, medium etc
Mark scheme (c)
Answer
Marks
Part marks and guidance
Point at (6, 1.4) indicated only
1
FT their plots from (a), If they have 2 outliers they must indicate both or just (6, 1.4)
Mark scheme (d)
Answer
Marks
Part marks and guidance
(i) Ruled line of best fit and answer FT \(\pm\) 0.01 their straight ruled line at 8 years
2
B1 for ruled line of best fit or answer FT \(\pm\) 0.01 their straight ruled line with positive gradient
Use overlay for LOBF, ruled line needs to reach both gates set at: (2, 0.8) and (2, 0.94) (13, 1.54) and (13, 1.66)
(ii) This child will fit the average pattern and will not be too tall or too short for their age oe
1
See appendix Ignore incorrect statements
Appendix
Exemplar responses for Q21dii
Response
Mark
Kai has average height
1
Kai fits in with everyone else (and is not like a child age 6)
1
All children are similar/same height[s] at that age
1
Kai fits the trend
1
His height fits the line of best fit
1
That he is not too small/too tall (accept assumptions that imply that the growth is performing as expected for the average)
1
He follows the pattern. He could be tall or short for his age (accept the first part ignore incorrect statement)
1
That he has not had any growth problems (accept assumptions that imply that the growth has not been different to normal for some reason) (reason must be given)
1
The sample of children is representative oe
1
Kai is the same height as another 8 year old
0
Kai grows according to the line on the graph
0
Kai is shorter than expected for their age (incorrect – should be Kai is not shorter …..)
0
Assumption: the older you get, the taller you will grow
0
He will be in the middle of a 7 and 9 yr old
0
Kai is exactly 8 years old (needs more)
0
My line of best fit is accurate
0
Between 7 and 8 there is not much growth
0
Children age as they grow
Mark scheme (e)
Answer
Marks
Part marks and guidance
Only have data on students up to 14 years old oe
1
Accept e.g. The trend may not continue The line of best fit should not extend beyond the data provided Outside range of data provided oe Small sample Do not accept e.g. 17 is not on the graph The graph does not go to 17 (alone)
See appendix Ignore incorrect statements
Appendix
Exemplar responses for Q21e
Reason must refer to or imply no data above 14 and not just refer to the graph not going above 14 alone. Accept children, plots/points as implying data.
Response
Mark
It is extrapolated and not in the data provided
1
The diagram has no ages/data above 14 (underlined part gets the mark)
1
Insufficient data (small sample reference)
1
The graph does not go up to 17 as there is no data above 14 (underlined part gets the mark)
1
We do not know that the pattern of growth will continue above 14 (implies trend may not continue)
1
The graph does not cover that data range (allow for the underlined part)
1
There are no children on the graph above 14 (accept children for data)
1
There are no plots/points on the graph above 14 (accept plots/points for data)
1
Medical deficiencies (not sufficient to describe trend may not continue)
0
Doesn’t have a growth disorder (not sufficient to describe trend may not continue)
0
Grows normally (not sufficient to describe trend may not continue)
0
The graph reaches up to 14 (not referring to data)
0
Extrapolated (needs explanation)
0
As you may stop growing by 17 (not sufficient to describe trend may not continue)
0
The graph only goes up to 14 (not referring to data)
0
The graph does not show information for 17 year olds
0
By 17 they won’t be growing at the same rate (not referring to data)
5 The table shows the ages and heights of 12 children.
Age (years)
2
4
12
6
10
11
13
11
5
7
9
14
Height (m)
0.84
1.01
1.5
1.4
1.4
1.35
1.62
1.42
1.14
1.24
1.26
1.68
The points for the first eight children (shaded in the table above) are plotted on the scatter diagram.
(a) Plot the points for the remaining four children. [2]
(b) Describe the type of correlation shown in the completed scatter diagram. [1]
(c) One of these children is taller than expected for their age.
On the scatter diagram, circle the point representing this child. [1]
(d)
(i) Kai is 8 years old. By drawing a line of best fit, estimate Kai’s height. [2]
(ii) Describe an assumption you have made in giving your answer to part (d)(i). [1]
(e) Explain why using this data to estimate the height of a child that is 17 years old may be unreliable. [1]
Mark scheme (a)
Answer
Marks
Part marks and guidance
Four correctly plotted points
2
B1 for 2 or 3 correct plots
Use overlay as a guide, ± half small square radially
Mark scheme (b)
Answer
Marks
Part marks and guidance
Positive
1
Do not accept description of relationship
Condone embellishments e.g. strong moderate, medium etc
Mark scheme (c)
Answer
Marks
Part marks and guidance
Point at (6, 1.4) indicated only
1
FT their plots from (a), If they have 2 outliers they must indicate both or just (6, 1.4)
Mark scheme (d)
Answer
Marks
Part marks and guidance
(d)(i)
Ruled line of best fit
and
answer FT ± 0.01 their straight ruled line at 8 years
2
B1 for ruled line of best fit or answer FT ± 0.01 their straight ruled line with positive gradient
Use overlay for LOBF, ruled line needs to reach both gates set at: (2, 0.8) and (2, 0.94) (13, 1.54) and (13, 1.66)
(d)(ii)
This child will fit the average pattern and will not be too tall or too short for their age oe
1
See appendix 2 Ignore incorrect statements
Appendix 2: exemplar responses for Question 5dii
Response
Mark
1
Kai has average height
1
2
Kai fits in with everyone else (and is not like a child age 6)
1
3
All children are similar/same height[s] at that age
1
4
Kai fits the trend
1
5
His height fits the line of best fit
1
6
That he is not too small/too tall (accept assumptions that imply that the growth is performing as expected for the average)
1
7
He follows the pattern. He could be tall or short for his age (accept the first part ignore incorrect statement)
1
8
That he has not had any growth problems (accept assumptions that imply that the growth has not been different to normal for some reason, reason must be given)
1
9
The sample of children is representative oe
1
10
Kai is the same height as another 8 year old
0
11
Kai grows according to the line on the graph.
0
12
Kai is shorter than expected for their age. (incorrect – should be Kai is not shorter ….. )
0
13
Assumption: the older you get, the taller you will grow
0
14
He will be in the middle of a 7 and 9 yr old.
0
15
Kai is exactly 8 years old (needs more)
0
16
My line of best fit is accurate
0
17
Between 7 and 8 there is not much growth
0
18
Children age as they grow
0
Mark scheme (e)
Answer
Marks
Part marks and guidance
Only have data on students up to 14 years old oe
1
Accept e.g. The trend may not continue The line of best fit should not extend beyond the data provided Outside range of data provided oe Small sample Do not accept e.g. 17 is not on the graph The graph does not go to 17 (alone)
See appendix 3 Ignore incorrect statements
Appendix 3: exemplar responses for Question 5e
Reason must refer to or imply no data above 14 and not just refer to the graph not going above 14 alone. Accept children, plots/points as implying data.
Response
Mark
1
It is extrapolated and not in the data provided
1
2
The diagram has no ages/data above 14 (underlined part gets the mark)
1
3
Insufficient data (small sample reference)
1
4
The graph does not go up to 17 as there is no data above 14 (underlined part gets the mark)
1
5
We do not know that the pattern of growth will continue above 14 (implies trend may not continue)
1
6
The graph does not cover that data range (allow for the underlined part)
1
7
There are no children on the graph above 14 (accept children for data)
1
8
There are no plots/points on the graph above 14 (accept plots/points for data)
1
9
Medical deficiencies (not sufficient to describe trend may not continue)
0
10
Doesn’t have a growth disorder (not sufficient to describe trend may not continue)
0
11
Grows normally (not sufficient to describe trend may not continue)
0
12
The graph reaches up to 14 (not referring to data)
0
13
Extrapolated (needs explanation)
0
14
As you may stop growing by 17 (not sufficient to describe trend may not continue)
0
15
The graph only goes up to 14 (not referring to data)
0
16
The graph does not show information for 17 year olds
0
17
By 17 they won’t be growing at the same rate (not referring to data)
Overlay gives guidance, tolerance \(\pm\tfrac{1}{2}\) small square
Mark scheme (b)
Answer
Marks
Part marks and guidance
Positive
1
Ignore embellishments
Mark scheme (c)
Answer
Marks
Part marks and guidance
(i) Circles \((30, 66)\) only
1
Accept any clear indication
(ii) 120
3
M2 for \(\dfrac{66 - 30}{30}\) \([\times 100]\) oe or for \(\dfrac{66}{30} \times 100\) [\(-100\)] oe or M1 for \(\dfrac{66}{30}\) oe or for \(66 - 30\) oe
For M2 and M1 FT their (c)(i), point must be chosen for FT (table or graph) M2 implied by 1.2 or 220
M1 implied by 2.2 or 36
Mark scheme (d)
Answer
Marks
Part marks and guidance
No and line of best fit should not extend beyond data provided oe
1
e.g. only have data up to 70 marks, No one scored that high [so the trend may not continue] He would need to extrapolate beyond the line of best fit Do not accept e.g. the graph only goes up to 90 for the second test
M2 for \(\dfrac{66 - 30}{30}\)[×100] oe or for \(\dfrac{66}{30} \times 100\) [–100] oe or M1 for \(\dfrac{66}{30}\) oe or for 66 – 30 oe
For M2 and M1 FT their (c)(i), point must be chosen for FT (table or graph) M2 implied by 1.2 or 220
M1 implied by 2.2 or 36
Mark scheme (d)
Answer
Marks
Part marks and guidance
No and line of best fit should not extend beyond data provided oe
1
eg only have data up to 70 marks. No one scored that high [so the trend may not continue]. He would need to extrapolate beyond the line of best fit. Do not accept e.g. the graph only goes up to 90 for the second test
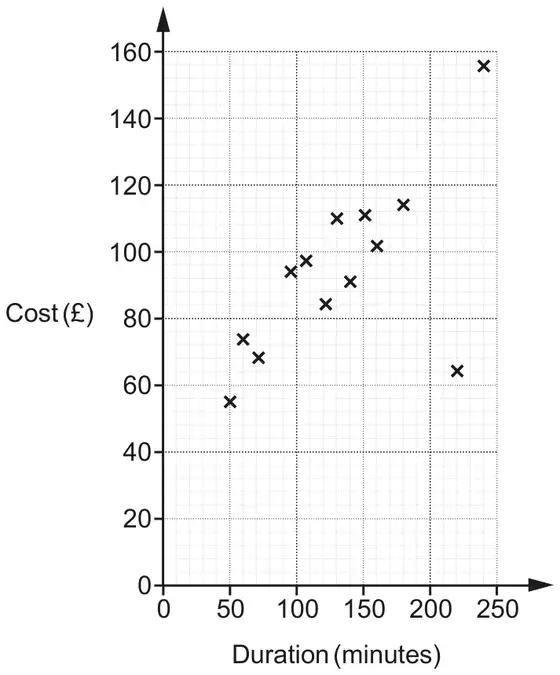
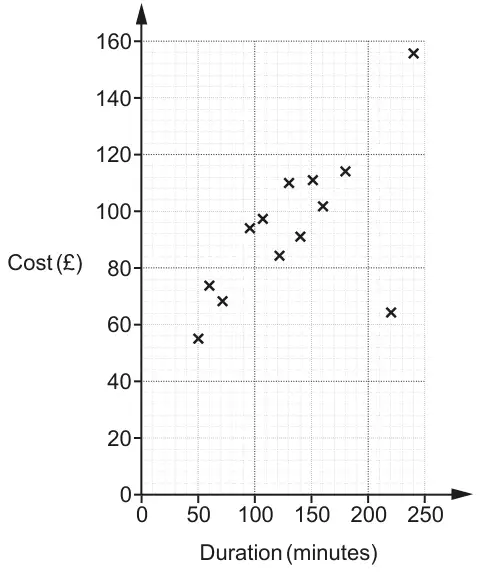
14 A travel agent records the duration and cost of the 15 flights he sold on one day. The data for the first 13 flights are plotted on the scatter diagram.
(a) The data for the final two flights is:
Duration
210 minutes
1 hour 40 minutes
Cost
£130
£80
Plot these flights on the scatter diagram. [2]
(b) The cost of one of the 15 flights had been discounted in a sale.
Circle the most likely flight on the scatter diagram. [1]
(c)
(i) Draw a line of best fit on the scatter diagram. [1]
(ii) Use your line of best fit to estimate the duration of a flight costing £90. [1]
(d) Explain why the travel agent should not use his records to estimate the cost of a 7 hour flight. [1]
Mark scheme (a)
Answer
Marks
Part marks and guidance
Points plotted at (210, 130) and (100, 80)
2
B1 for 100 soi or for one point plotted correctly
Half square tolerance May be implied by point plotted at duration 100
Mark scheme (b)
Answer
Marks
Part marks and guidance
Point at (220, 64) circled
1
Mark scheme (c)
Answer
Marks
Part marks and guidance
(i) Ruled line of best fit drawn
1
Use overlay anchored on top right point Line must reach to edges of overlay
(ii) Their line used to give duration for £90 ± 5 minutes
1 FT
Strict FT from their intended straight line of best fit
NB read \((n, 90)\) not \((90, n)\)
Mark scheme (d)
Answer
Marks
Part marks and guidance
[7 hours is] is beyond the given data oe
1
Accept eg the trend may not continue
Appendix
Exemplar responses for Q14d
Response
Mark
No because it does not have a record for 7 hours
This scores 0 as there is no record for e.g. 80 min. Must imply “beyond”
0
7 hours isn’t on the scale.
No. Implies a bigger diagram would be OK
0
No Because 420 minutes is too long to fit on the graph
Implies it would be OK with a bigger graph
0
No It only shows 2h 50 minutes
Suggests 7 hours is a missing value
0
No It would go up to 4200.
No. Implies scale not long enough
0
No Highest duration is 250 mins which isn’t 7 hours. 420 mins is 7 hours.
No. Implies a bigger diagram would be OK
0
No His records only go up to 4hours 10minutes.
No. This is about the scale. However, if they had said 4 hours, then they would have been talking about the data
0
No It does not show this information. 7x60 = 420mins. Graph only goes up to 250 mins.
No...scale again
0
No His record doesn’t show any 7 hour flights.
No. Implies it is a missing value
0
No It would not fit on the graph.
No. Implies a bigger diagram would be OK
0
No Duration only goes to 250 mins.
No. Implies a bigger diagram would be OK
0
No Graph does not go beyond 250 minutes. 60x7 = 420mins.
No. Implies a bigger diagram would be OK
0
No Extrapolation
Not explained
0
No. The data only shows a maximum of a 250 minute flight so this would be unreliable
Contradiction. 240 rather than 250 would have been acceptable.
0
No. Should not extrapolate beyond 250 minutes/the graph
Graph not big enough
0
No. Extrapolating too far meaning his estimate would be inaccurate
Not quite sufficiently clear. What is “too far” and is it from 240 or 250?
0
No Duration does not go up to 7 hours.
No. Implies a bigger diagram would be OK
0
No There are only less amount of flights on the diagram.
Yes. This implies “beyond the data”
1
No because the duration only goes up to 240 minutes
Scores the mark for implying beyond the data
1
No because it does not have records that go as far as 7 hours.
This is OK as it implies “beyond”
1
No. Should not extrapolate beyond 240 minutes/the data
1 A travel agent records the duration and cost of the 15 flights he sold on one day. The data for the first 13 flights are plotted on the scatter diagram.
(a) The data for the final two flights is:
Duration
210 minutes
1 hour 40 minutes
Cost
£130
£80
Plot these flights on the scatter diagram. [2]
(b) The cost of one of the 15 flights had been discounted in a sale.
Circle the most likely flight on the scatter diagram. [1]
(c)
(i) Draw a line of best fit on the scatter diagram. [1]
(ii) Use your line of best fit to estimate the duration of a flight costing £90. [1]
(d) Explain why the travel agent should not use his records to estimate the cost of a 7 hour flight. [1]
Mark scheme (a)
Answer
Marks
Part marks and guidance
Points plotted at (210, 130) and (100, 80)
2
B1 for 100 soi or for one point plotted correctly
Half square tolerance May be implied by point plotted at duration 100
Mark scheme (b)
Answer
Marks
Part marks and guidance
Point at (220, 64) circled
1
Mark scheme (c)
Answer
Marks
Part marks and guidance
(i) Ruled line of best fit drawn
1
Use overlay anchored on top right point Line must reach to edges of overlay
(ii) Their line used to give duration for £90 ± 5 minutes
1 FT
Strict FT from their intended straight line of best fit
NB read (\(n\), 90) not (90, \(n\))
Mark scheme (d)
Answer
Marks
Part marks and guidance
[7 hours is] is beyond the given data oe
1
Accept eg the trend may not continue
Appendix: Q1(d)
Response
Mark
No because it does not have a record for 7 hours
This scores 0 as there is no record for e.g. 80 min. Must imply “beyond”
0
7 hours isn't on the scale.
No. Implies a bigger diagram would be OK
0
No Because 420 minutes is too long to fit on the graph
Implies it would be OK with a bigger graph
0
No It only shows 2h 50 minutes
Suggests 7 hours is a missing value
0
No It would go up to 4200.
No implies scale not long enough
0
No Highest duration is 250 mins which isn't 7 hours. 420 mins is 7 hours.
No. Implies a bigger diagram would be OK
0
No His records only go up to 4hours 10minutes.
No. This is about the scale. However, if they had said 4 hours, then they would have been talking about the data
0
No It does not show this information. 7x60 = 420mins. Graph only goes up to 250mins.
No scale again
0
No His record doesn't show any 7 hour flights.
No. Implies it is a missing value
0
No It would not fit on the graph.
No. Implies it is a missing value
0
No Duration only goes to 250 mins.
No. Implies it is a missing value
0
No Graph does not go beyond 250 minutes. 60x7 = 420mins.
No. Implies it is a missing value
0
No Duration does not go up to 7 hours.
No. Implies a bigger diagram would be OK
0
No Extrapolation
Not explained
0
No. Should not extrapolate beyond 250 minutes/the graph
Graph not big enough
0
No. Extrapolating too far meaning his estimate would be inaccurate
Not quite sufficiently clear. What is “too far” and is it from 240 or 250?
0
No. The data only shows a maximum of a 250 minute flight so this would be unreliable
Contradiction. 240 rather than 250 would have been acceptable.
0
No There are only less amount of flights on the diagram.
Yes. This implies “beyond the data”
1
No because the duration only goes up to 240 minutes
Scores the mark for implying beyond the data
1
No because it does not have records that go as far as 7 hours.
This is OK as it implies “beyond”
1
No. Should not extrapolate beyond 240 minutes/the data
19 12 students take two tests. Each test is out of 60. The scatter diagram shows the results for 10 of the students.
(a) The table shows the results for the other 2 students.
Test 1
36
38
Test 2
44
41
Plot these results on the scatter diagram. [1]
(b) Describe the type of correlation shown in the scatter diagram. [1]
(c)
(i) Draw a line of best fit on the scatter diagram. [1]
(ii) Another student was absent for Test 2. The student scored 40 marks on Test 1.
Use your line of best fit to estimate a result for this student on Test 2. [1]
(d) Work out the percentage of the 12 students whose result on Test 1 is lower than their result on Test 2. [4]
Mark scheme (a)
Answer
Marks
Part marks and guidance
2 points plotted correctly
1
tolerance ± ½ small square
Mark scheme (b)
Answer
Marks
Part marks and guidance
positive
1
Ignore embellishments
Mark scheme (c)
Answer
Marks
Part marks and guidance
(i) acceptable ruled line
1
see overlay, it must be at least from \(x = 10\) to \(x = 45\) and between (10,4) to (10,12) and (45,40) to (45,50) if more than 1 line, both must be in tolerance, ignore horizontal and vertical lines.
(ii) 35 to 44
1
for answers out of tolerance FT their ruled line with positive gradient with tolerance ± ½ small square
Mark scheme (d)
Answer
Marks
Part marks and guidance
42 or 41.7 or 41.66… or 41.67
4
B1 for 5 M1 for \(\dfrac{\textit{their } 5}{12}\) M1 for \(\left(\textit{their } \dfrac{5}{12}\right) \times 100\) If 0 scored SC2 for answer of 30 from \(\dfrac{3}{10}\) or 36[.36…] or 36.4 from \(\dfrac{4}{11}\)
7 12 students take two tests. Each test is out of 60. The scatter diagram shows the results for 10 of the students.
(a) The table shows the results for the other 2 students.
Test 1
36
38
Test 2
44
41
Plot these results on the scatter diagram. [1]
(b) Describe the type of correlation shown in the scatter diagram. [1]
(c)
(i) Draw a line of best fit on the scatter diagram. [1]
(ii) Another student was absent for Test 2. The student scored 40 marks on Test 1.
Use your line of best fit to estimate a result for this student on Test 2. [1]
(d) Work out the percentage of the 12 students whose result on Test 1 is lower than their result on Test 2. [4]
Mark scheme (a)
Answer
Marks
Part marks and guidance
2 points plotted correctly
1
tolerance ± ½ small square
Mark scheme (b)
Answer
Marks
Part marks and guidance
positive
1
Ignore embellishments
Mark scheme (c)
Answer
Marks
Part marks and guidance
(i) acceptable ruled line
1
see overlay, it must be at least from \(x = 10\) to \(x = 45\) and between (10,4) to (10,12) and (45,40) to (45,50) if more than 1 line, both must be in tolerance, ignore horizontal and vertical lines.
(ii) 35 to 44
1
for answers out of tolerance FT their ruled line with positive gradient with tolerance ± ½ small square
Mark scheme (d)
Answer
Marks
Part marks and guidance
42 or 41.7 or 41.66… or 41.67
4
B1 for 5 M1 for \(\frac{\textit{their}\ 5}{12}\) M1 for (their \(\frac{5}{12}\)) × 100 If 0 scored SC2 for answer of 30 from \(\frac{3}{10}\) or 36[.36…] or 36.4 from \(\frac{4}{11}\)
5 The table shows the ages and values of 11 cars of the same model.
Age (years)
4
7
11
1
9
10
4
3
7
8
12
Value (thousands of pounds)
9.2
6.0
1.2
11.4
2.3
4.2
3.4
8.0
5.6
5.0
0.4
The points for the first 7 cars are plotted on the scatter diagram.
(a) Plot the points for the remaining 4 cars. [2]
(b) Describe the type and strength of the correlation shown in the completed scatter diagram. [2]
(c) One car lost its value more quickly than the other cars.
On the scatter diagram, draw a circle around the point representing this car. [1]
(d) By drawing a line of best fit, estimate the value of a car that is 6 years old. [2]
(e) Explain the limitations of using the equation of the line of best fit to estimate the value of a car that is 16 years old. [1]
Mark scheme (a)
Answer
Marks
Part marks and guidance
Four points correctly plotted
2
B1 for 2 or 3 correct plots
Mark in 70% zoom, use overlay, points inside or touching circles
Mark scheme (b)
Answer
Marks
Part marks and guidance
Negative
Strong
1
1
Do not accept description of relationship
Accept moderate, medium etc, but not weak
Mark scheme (c)
Answer
Marks
Part marks and guidance
Point at (4, 3.4) indicated only
1
Mark scheme (d)
Answer
Marks
Part marks and guidance
Ruled line of best fit
and
answer FT their line ± 100
2
B1 for ruled line of best fit or for answer FT their line with negative gradient
Use overlay for LOBF, ruled line should be as long as the zone and should not cross the longer sides of the zone
Not for e.g. 6.4 thousand
Mark scheme (e)
Answer
Marks
Part marks and guidance
Only have data on cars up to 12 years old oe or Equation of line of best fit would give a negative value or zero oe
1
e.g. the trend may not continue It would give a negative cost Outside range of data provided oe The price would be below zero The price would be zero oe See AG Do not accept 16 is not on the graph The graph does not go to 16
Ignore incorrect statements
Appendix: exemplar responses for Q5(e)
Response
Mark
1
The line of best fit would hit zero before 16 years old and a car is always worth something
1
2
16 years is off the scale so the estimate would be inaccurate as the correlation may change (Ignore insufficient first part – this gets it for the final part underlined)
1
3
No data for a car 16 years old
1
4
The equation will give a negative value
1
5
Data is only provided for cars up to 12 years old, so we don’t know beyond that
1
6
Should not extrapolate beyond 12 years
1
7
Car prices will never be zero BOD
1
8
Rate of value loss may not be constant (BOD trend does not continue)
1
9
16 years is not on the graph
0
10
Worth is not decreasing at a standard rate, it is fluctuating
0
11
Graph only goes to 12 years and it is less likely cars will be 16 years old
0
12
Starts to curve off which is not shown on the graph
0
13
Just an average, depends on the condition, mileage etc
16 In a dance competition, two judges each award scores out of 30. The scatter diagram shows the scores awarded to the first 10 dancers.
(a) Here are the scores for the next two dancers.
Judge A
21
7
Judge B
18
8
Plot their scores on the scatter diagram. [1]
(b) Dancers who are awarded a score of more than 20 by both judges receive a medal.
For the 12 dancers, express the ratio of medal winners to non-medal winners in its simplest form. [3]
(c) This chart shows the types of dance performed by the 12 dancers.
3 performed a street dance, 8 performed a jazz dance and 1 performed a tap dance.
Why is this diagram misleading? [1]
Mark scheme (a)
Answer
Marks
Part marks and guidance
Points plotted at (21, 18) and (7, 8)
1
Tolerance ±1 mm
Mark scheme (b)
Answer
Marks
Part marks and guidance
1 : 3
3
B2 for 3 : 9 oe or answer 3 : 1
or
B1 for 3 [dancers] or 9 [dancers] identified
If 0 scored then SC1 for 4 : 8 seen and simplified to 1 : 2
NOT from 4 : 12
May be on graph 4 : 12 simplified to 1 : 3 scores 0
Mark scheme (c)
Answer
Marks
Part marks and guidance
The wedges at the front look bigger than those at the back oe
1
Comments should refer to the 3D nature of the pie chart e.g. It’s tilted, slanted, seen from an angle etc. Ignore all references to missing angles, not being joined, etc. Mark the best bit unless contradicted
1 In a dance competition, two judges each award scores out of 30. The scatter diagram shows the scores awarded to the first 10 dancers.
(a) Here are the scores for the next two dancers.
Judge A
21
7
Judge B
18
8
Plot their scores on the scatter diagram. [1]
(b) Dancers who are awarded a score of more than 20 by both judges receive a medal.
For the 12 dancers, express the ratio of medal winners to non-medal winners in its simplest form. [3]
(c) This chart shows the types of dance performed by the 12 dancers. 3 performed a street dance, 8 performed a jazz dance and 1 performed a tap dance.
Why is this diagram misleading? [1]
Mark scheme (a)
Answer
Marks
Part marks and guidance
Points plotted at (21, 18) and (7, 8)
1
Tolerance ±1 mm
Mark scheme (b)
Answer
Marks
Part marks and guidance
1 : 3
3
B2 for 3 : 9 oe or answer 3 : 1 or B1 for 3 [dancers] or 9 [dancers] identified
If 0 scored then SC1 for 4 : 8 seen and simplified to 1 : 2
NOT from 4 : 12 May be on graph 4 : 12 simplified to 1 : 3 scores 0
Mark scheme (c)
Answer
Marks
Part marks and guidance
The wedges at the front look bigger than those at the back oe
1
Comments should refer to the 3D nature of the pie chart e.g. It’s tilted, slanted, seen from an angle etc. Ignore all references to missing angles, not being joined, etc. Mark the best bit unless contradicted
15 Lee wishes to find out if there is a relationship between a person’s age and the time it takes them to complete a puzzle.
Lee decides to conduct an experiment. She asks 12 people to complete the puzzle. She records each person’s age and the time taken to complete the puzzle.
(a) Make one criticism of Lee’s method. [1]
This scatter diagram shows the results for ten of the people in Lee’s experiment.
(b) Here are the other two results.
Age (years)
47
60
Time (seconds)
21
34
Plot these results on the scatter diagram. [2]
(c) What type of correlation is shown in the scatter diagram? [1]
(d) Estimate the time it would take a person aged 35 to complete the puzzle. Show your working to justify your answer. [2]
(e) Lee says that at least 80% of the 12 people completed the puzzle in under 30 seconds.
Is Lee correct? Show working to support your answer. [3]
Mark scheme (a)
Answer
Marks
Part marks and guidance
accept any correct explanation e.g. sample size is small, no mention of subjects being randomly selected
1
If more than one choose the best one see list of exemplars
Mark scheme (b)
Answer
Marks
Part marks and guidance
two points accurately plotted
2
B1 for each
tolerance \(\pm\frac{1}{2}\) small square and use overlay as a guide
Mark scheme (c)
Answer
Marks
Part marks and guidance
positive
1
ignore any extras e.g. strong
Mark scheme (d)
Answer
Marks
Part marks and guidance
a line or a mark between (35,9) and (35,15)
1
use overlay as a guide, a clear indication of method to find their answer
9 to 15
1
Mark scheme (e)
Answer
Marks
Part marks and guidance
9 soi
B1
9 can be implied by 75
For putting their 9 out of 12 into a percentage oe e.g. 9 in 12 or \(\dfrac{9}{12}\) [=] 75[%]
M1
Accept any correct reasoning e.g. M1 for 0.80 \(\times\) 12 or 9.6
Accept fractions or decimals providing the two figures can be compared
A correct conclusion from their 9 e.g. “No/She is wrong”
A1FT
A1FT for a correct conclusion from their 9 e.g. “No/She is wrong”
If no points plotted in (b) award M1 for 8 [out of 10] = 80[%] and A1 for “Yes”
4 Lee wishes to find out if there is a relationship between a person’s age and the time it takes them to complete a puzzle.
Lee decides to conduct an experiment. She asks 12 people to complete the puzzle. She records each person’s age and the time taken to complete the puzzle.
(a) Make one criticism of Lee’s method. [1]
(b) This scatter diagram shows the results for ten of the people in Lee’s experiment.
Here are the other two results.
Age (years)
47
60
Time (seconds)
21
34
Plot these results on the scatter diagram. [2]
(c) What type of correlation is shown in the scatter diagram? [1]
(d) Estimate the time it would take a person aged 35 to complete the puzzle.
Show your working to justify your answer. [2]
(e) Lee says that at least 80% of the 12 people completed the puzzle in under 30 seconds.
Is Lee correct?
Show working to support your answer. [3]
Mark scheme (a)
Answer
Marks
Part marks and guidance
accept any correct explanation
e.g. sample size is small, no mention of subjects being randomly selected
1
If more than one choose the best one see list of exemplars
Appendix: exemplar responses for Q4(a)
Response
Mark
sample size is small
1
no mention of subjects being randomly selected(e.g. could be her friends)
1
in the same room so they could watch each other solve it
1
Some people may be experience at solving puzzles
1
Need people of different ages
1
We don’t know their gender
0
Mark scheme (b)
Answer
Marks
Part marks and guidance
two points accurately plotted
2
B1 for each
tolerance \(\pm\frac{1}{2}\) small square and use overlay as a guide
Mark scheme (c)
Answer
Marks
Part marks and guidance
positive
1
ignore any extras e.g. strong
Mark scheme (d)
Answer
Marks
Part marks and guidance
a line or a mark between (35,9) and (35,15)
1
use overlay as a guide, a clear indication of method to find their answer
9 to 15
1
Mark scheme (e)
Answer
Marks
Part marks and guidance
9 soi
B1
9 can be implied by 75
For putting their 9 out of 12 into a percentage oe e.g. 9 in 12 or \(\dfrac{9}{12}\) [=] 75[%]
M1
Accept any correct reasoning e.g. M1 for 0.80 × 12 or 9.6
Accept fractions, decimals or percentages providing the two figures can be compared
A correct conclusion from their 9 e.g. “No/she is wrong”
A1FT
A1FT for a correct conclusion from their 9 e.g. “No/she is wrong”
If no points plotted in (b) award M1 for 8 [out of 10] = 80[%] and A1 for “Yes”
(a) The owner of a tourist attraction records the amount of rainfall, in millimetres, and the number of visitors each day. The results for 10 days are shown in the scatter diagram.
(i) Circle the outlier on the scatter diagram. [1]
(ii) The owner claims that he would expect around 320 visitors on a day with 2 mm of rainfall.
Does the scatter diagram support his statement? Explain how you made your decision. [2]
(iii) Explain why the scatter diagram should not be used to estimate the number of visitors on a day with 9 mm of rainfall. [1]
(b) The pie chart summarises information about the visitors to the tourist attraction on a different day.
Explain why the pie chart cannot be used to work out how many adults visited on that day. [1]
Mark scheme (a)
Answer
Marks
Part marks and guidance
(i) Point (0.8, 120) indicated
1
(ii) No oe and Correct supporting value(s) and justification
2
B1 for 200 to 260 visitors expected or about 0 to 1 mm and 320 or line of best fit within overlay or negative trend/correlation or markings in relevant region above 2mm or 2 or more values within overlay and surrounding 2mm
Justification includes Reference to line of best fit (drawn or not) or trend or negative correlation or markings in relevant region above 2mm or surrounding values See Appendix
(iii) Outside range of data [collected]
1
Accept “The data (or diagram) only goes to 5.5 (or 6)” oe
Do not accept “by 6 to 7 it would give no visitors” oe or There is no data around 9 mm oe The line of best fit does not reach 9 mm oe
Condone “[Because] there would be a negative number of people” See Appendix
Appendix
Exemplar responses for Q16(a)(ii)
Response
Mark
(line drawn on graph) no, following the scatter diagram points there would be an estimate of around 240 visitors Take “following the scatter diagram points” refers to the line and a supporting value
2
No we expect 250 (reference to line or markings drawn)
2
No, a line of best fit would show 250 (no line)
2
No, 0-1 mm shows 320 but we would expect less as it is decreases/negative trend
2
No, (point below 2mm and point above 2mm stated) so there is a negative trend
2
no as with 1mm rain its 280 visitors so with 2mm you should get around 245 B1 for 245 expected at 2mm but no reference to trend
1
having drawn a line of best fit the scatter diagram wouldn’t support this as it’s too big a number No explicit supporting value used
1
no, by looking at the diagram you would expect about 240 Supporting value in range but no justification
1
no because with 1mm there’s less than 320 visitors 1 mm and 320 are the supporting values but no reference to trend
1
no because there were 320 visitors on a day with 0mm rainfall 0 mm and 320 are the supporting values but no reference to trend
1
No we expect 250 (nothing else)
1
(No valid comment) line of best fit within overlay
1
No, 0-1 mm shows 320
1
No, 320 is for 1mm
1
No, negative trend
1
No, (point below 2mm and point above 2mm stated)
1
the scatter diagram doesn’t support his statement as there isn’t any rainfall that is 2mm No supporting value
0
no it doesn’t because when the rainfall was 2mm he didn’t have any visitors Wrong
0
the closest amount of visitors to 2mm of rainfall is 290 An estimate that is out of range and is probably referring to the nearest point plotted. No reference to trend
0
No, as on a day with 1mm there are fewer customers
0
Yes …
0
Exemplar responses for Q16(a)(iii)
Response
Mark
Outside range of data collected Perfect!!
1
because there is no data to show above 6mm of rainfall Equivalent answer
1
because the values of 7 and 8mm are not plotted, therefore it would be hard to estimate 9mm Similar to “no data around 9mm”
0
no record of any visitors are shown at 9mm of rainfall. Visitors stop coming when it hits 6mm of rainfall Equivalent to “no data for 9mm”
0
because there is not enough data to estimate the amount of visitors for 9mm of rainfall Does not say “no data beyond 5.5 (or 6) mm”
0
we don’t have the data to do a line of best fit Wrong
0
there is nothing recorded Wrong
0
you can’t plot this data the graph isn’t big enough Wrong
0
because that would create an outlier or anomalous piece of data Maybe but wrong
0
it wouldn’t be on the line Wrong
0
there would be under 50 visitors so it would be hard to get an accurate number Wrong
0
because the experiment was only tested for 10 days, you would need to have more evidence to estimate how many visitors would come on 9mm rainfall Probably correct but has missed the point that THESE data do not extend beyond 5.5 mm
0
because the rain might be too heavy for visitors to come True but not answering the question
0
Mark scheme (b)
Answer
Marks
Part marks and guidance
Total number or number of children is not known oe or The chart only shows proportions/percentages oe
1
Mark the best bit so long as no contradiction
See Appendix
Appendix
Exemplar responses for Q16(b)
Response
Mark
The total number of visitors is not known True
1
there is no value of the amount of visitors that day For value read number
1
because there are more children and it don’t say how many there are in total Mark the best bit and no contradiction
1
there is no numbers to help us find our answer Too vague, could be referring to angles or number of adults
0
the pie chart doesn’t show any figures or percentages Too vague, could be referring to angles or number of adults (and final part incorrect)
0
they don’t have enough information Too vague
0
because you can’t tell what the percentage is Wrong
0
the tourist attraction could be aimed at children Wrong
(a) The owner of a tourist attraction records the amount of rainfall, in millimetres, and the number of visitors each day.
The results for 10 days are shown in the scatter diagram.
(i) Circle the outlier on the scatter diagram. [1]
(ii) The owner claims that he would expect around 320 visitors on a day with 2 mm of rainfall.
Does the scatter diagram support his statement? Explain how you made your decision. [2]
(iii) Explain why the scatter diagram should not be used to estimate the number of visitors on a day with 9 mm of rainfall. [1]
(b) The pie chart summarises information about the visitors to the tourist attraction on a different day.
Explain why the pie chart cannot be used to work out how many adults visited on that day. [1]
Mark scheme (a)
Answer
Marks
Part marks and guidance
(i) Point (0.8, 120) indicated
1
(ii) No oe and Correct supporting value(s) and justification
2
B1 for 200 to 260 visitors expected or about 0 to 1mm and 320 or line of best fit within overlay or negative trend/correlation or marking(s) in relevant region above 2mm or 2 or more values within overlay and surrounding 2mm
Justification includes Reference to line of best fit (drawn or not) or trend or negative correlation or marking(s) in relevant region above 2mm or surrounding values
See Appendix
(iii) Outside range of data [collected]
1
Accept “The data (or diagram) only goes to 5.5 (or 6)” oe
Do not accept “by 6 to 7 it would give no visitors” oe or There is no data around 9 mm oe The line of best fit does not reach 9 mm oe
Condone “[Because] there would be a negative number of people”
See Appendix
Appendix: Exemplar responses for Q3(a)(ii)
Response
Mark
(line drawn on graph) no, following the scatter diagram points there would be an estimate of around 240 visitors Take “following the scatter diagram points” refers to the line and a supporting value
2
no as with 1mm rain its 280 visitors so with 2mm you should get around 245 B1 for 245 expected at 2mm but no reference to trend
1
having drawn a line of best fit the scatter diagram wouldn’t support this as it’s too big a number No explicit supporting value used
1
no, by looking at the diagram you would expect about 240 Supporting value in range but no justification
1
no because with 1mm there’s less than 320 visitors 1 mm and 320 are the supporting values but no reference to trend
1
no because there were 320 visitors on a day with 0mm rainfall 0 mm and 320 are the supporting values but no reference to trend
1
the scatter diagram doesn’t support his statement as there isn’t any rainfall that is 2mm No supporting value
0
no it doesn’t because when the rainfall was 2mm he didn’t have any visitors Wrong
0
the closest amount of visitors to 2mm of rainfall is 290 An estimate that is out of range and is probably referring to the nearest point plotted. No reference to trend
0
No we expect 250 (reference to line or markings drawn)
2
No, a line of best fit would show 250 (no line)
2
No we expect 250 (nothing else)
1
(No valid comment) line of best fit within overlay
1
OR
No, 0-1 mm shows 320 but we would expect less as it is decreases/negative trend
2
No, 0-1 mm shows 320
1
No, 320 is for 1mm
1
No, negative trend
1
No, as on a day with 1mm there are fewer customers
0
OR
No, (point below 2mm and point above 2mm stated) so there is a negative trend
2
No, (point below 2mm and point above 2mm stated)
1
Yes …
0
Appendix: Exemplar responses for Q3(a)(iii)
Response
Mark
Outside range of data collected Perfect!!
1
because there is no data to show above 6mm of rainfall Equivalent answer
1
because the values of 7 and 8mm are not plotted, therefore it would be hard to estimate 9mm Similar to “no data around 9mm”
0
no record of any visitors are shown at 9mm of rainfall. Visitors stop coming when it hits 6mm of rainfall Equivalent to “no data for 9mm”
0
because there is not enough data to estimate the amount of visitors for 9mm of rainfall Does not say “no data beyond 5.5 (or 6) mm”
0
we don’t have the data to do a line of best fit Wrong
0
there is nothing recorded Wrong
0
you can’t plot this data the graph isn’t big enough Wrong
0
because that would create an outlier or anomalous piece of data Maybe but wrong
0
Mark scheme (b)
Answer
Marks
Part marks and guidance
Total number or number of children is not known oe or The chart only shows proportions/percentages oe
1
Mark the best bit so long as no contradiction
See Appendix
Appendix: Exemplar responses for Q3(b)
Response
Mark
The total number of visitors is not known True
1
there is no value of the amount of visitors that day For value read number
1
because there are more children and it don’t say how many there are in total Mark the best bit and no contradiction
1
there is no numbers to help us find our answer Too vague, could be referring to angles or number of adults
0
the pie chart doesn’t show any figures or percentages Too vague, could be referring to angles or number of adults (and final part incorrect)