
Foundation November 2021 Paper 3 Q21
21 The scatter graph shows information about the volume of traffic and the carbon monoxide level at a point on a road each day for 22 days.
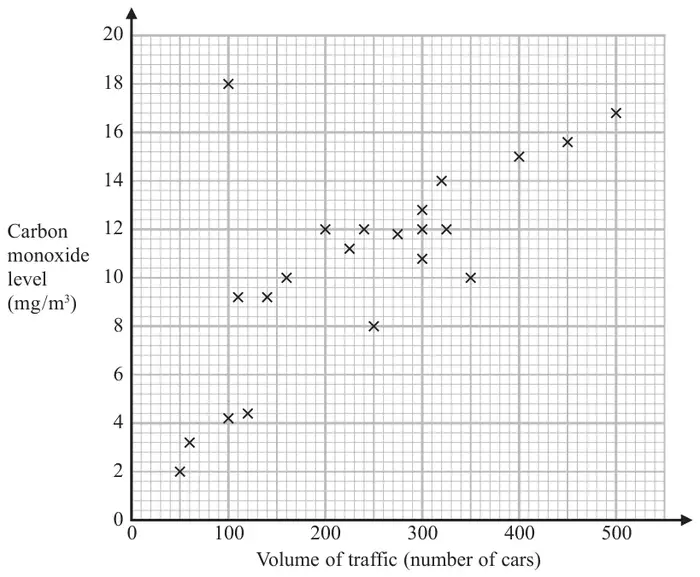
One point is an outlier.
(a) Write down the coordinates of this point. (1)
For another day, 370 cars pass the point on the road.
(b) Estimate the carbon monoxide level for this day. (2)
Alfie says,
“Because there is an outlier, there is no correlation.”
(c) Is Alfie correct?
You must give a reason for your answer. (1)
You must give a reason for your answer. (1)
| Answer | Mark | Mark scheme |
|---|---|---|
| (100, 18) | B1 | cao |
| Answer | Mark | Mark scheme |
|---|---|---|
| 12.8 to 14.8 | M1 | for a method to read off eg line of best fit or line up from 370 or for a point on the grid at \((370, y)\) where \(y\) lies between 12.8 and 14.8 |
| A1 | for an answer in the range 12.8 to 14.8 |
| Answer | Mark | Mark scheme |
|---|---|---|
| Decision and statement | C1 | for decision and statement Acceptable examples No, as this point can be disregarded from the general trend No, ignore this point No, the correlation is positive No, because even with an outlier you can still have a negative or positive correlation. No, there is still a correlation. No, as you can use the rest of the data to determine a correlation. No, as outlier does not affect the majority No as a line of best fit can still be drawn No, it is an anomaly Not acceptable examples Yes, … Outliers can be ignored [no decision] No, the outlier can be ignored so the correlation is negative No there are other things that can affect the test |