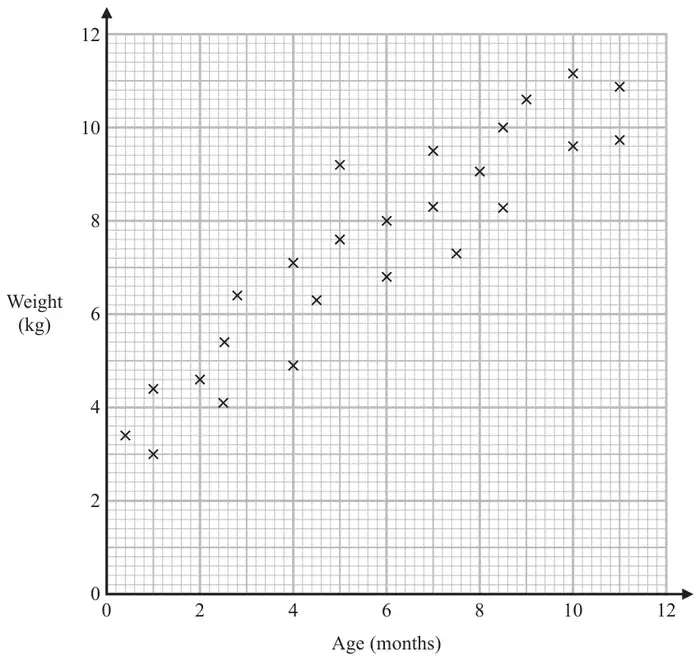
25 The scatter graph shows information about the ages and weights of some babies.
(a) Describe the relationship between the age and the weight of the babies. (1)
Another baby has a weight of 5.8 kg
(b) Using the scatter graph, find an estimate for the age of this baby. (2)
Mark scheme (a)
Answer
Mark
Mark scheme
Description
C1
for a valid description of the relationship Acceptable examples As age increases, weight increases The older you are the greater the weight Positive correlation
Not acceptable examples Positive (relationship) age and weight are in proportion strong correlation or correlation is increasing as the babies get older the heavier they get, negative correlation they are directly proportional, weight goes up as age goes up
Additional guidance
Accept positive correlation Ignore any comment about strength
Mark scheme (b)
Answer
Mark
Mark scheme
2.5 to 4.5
B2
for an answer in the range 2.5 to 4.5
(B1
for a suitable line of best fit drawn or for a point on the grid at \((x, 5.8)\) where \(x\) lies between 2.5 and 4.5 or a horizontal line drawn from 5.8 across to \((x, 5.8)\) where \(x\) is in the range 2.5 to 4.5)
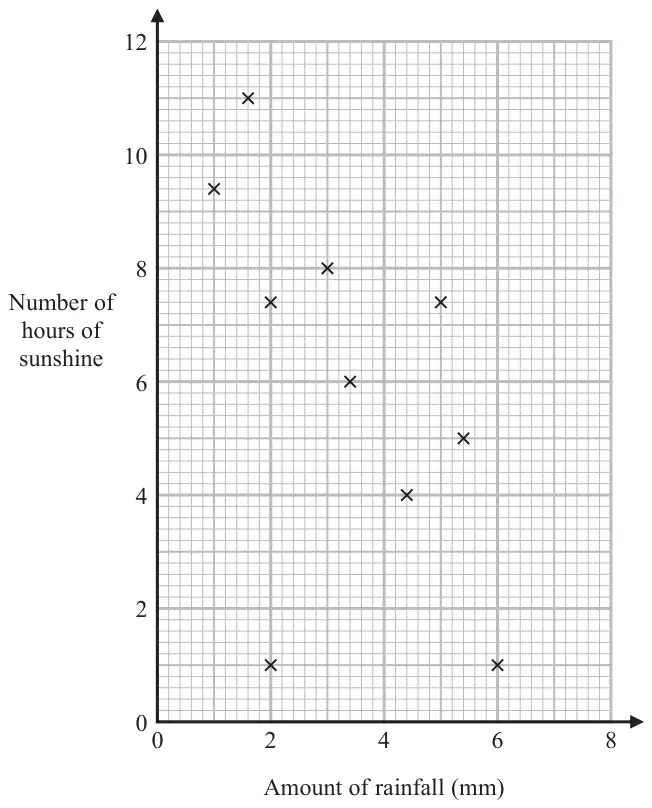
18 The scatter graph shows information about the amount of rainfall, in mm, and the number of hours of sunshine for each of ten English towns on the same day.
One of the points is an outlier.
(a) Write down the coordinates of this point. (1)
(b) Ignoring the outlier, describe the relationship between the amount of rainfall and the number of hours of sunshine. (1)
On the same day in another English town there were 7 hours of sunshine.
(c) Using the scatter graph, estimate the amount of rainfall in this town on this day. (2)
Mark scheme (a)
Answer
Mark
Mark scheme
(2, 1)
B1
cao
Mark scheme (b)
Answer
Mark
Mark scheme
Description
C1
correct description, eg as the amount of rainfall decreases the number of hours of sunshine increases
Additional guidance
Accept negative correlation Ignore any comment about strength Any numbers used in the description must be within tolerance
Mark scheme (c)
Answer
Mark
Mark scheme
3 to 4
M1
for a suitable line of best fit drawn, or for a point marked at \((x, 7)\), or a horizontal line drawn from 7 across to \((x, 7)\) where \(x\) is in the range 2.5 to 4
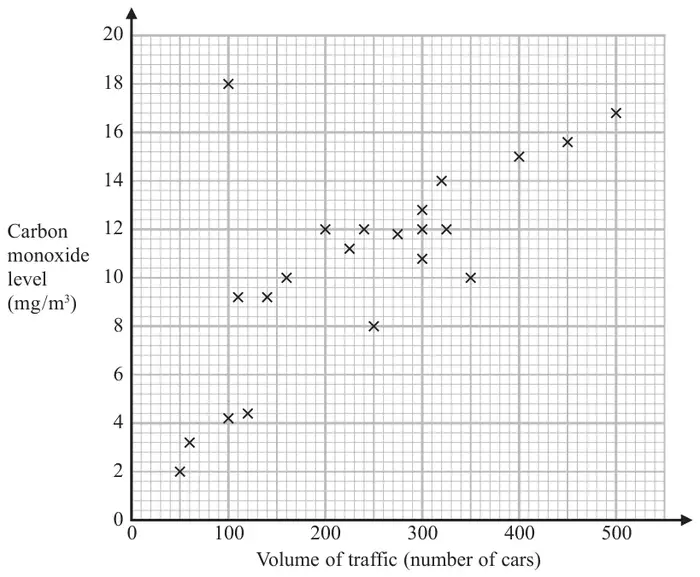
21 The scatter graph shows information about the volume of traffic and the carbon monoxide level at a point on a road each day for 22 days.
One point is an outlier.
(a) Write down the coordinates of this point. (1)
For another day, 370 cars pass the point on the road.
(b) Estimate the carbon monoxide level for this day. (2)
Alfie says,
“Because there is an outlier, there is no correlation.”
(c) Is Alfie correct? You must give a reason for your answer. (1)
Mark scheme (a)
Answer
Mark
Mark scheme
(100, 18)
B1
cao
Mark scheme (b)
Answer
Mark
Mark scheme
12.8 to 14.8
M1
for a method to read off eg line of best fit or line up from 370 or for a point on the grid at \((370, y)\) where \(y\) lies between 12.8 and 14.8
A1
for an answer in the range 12.8 to 14.8
Mark scheme (c)
Answer
Mark
Mark scheme
Decision and statement
C1
for decision and statement Acceptable examples No, as this point can be disregarded from the general trend No, ignore this point No, the correlation is positive No, because even with an outlier you can still have a negative or positive correlation. No, there is still a correlation. No, as you can use the rest of the data to determine a correlation. No, as outlier does not affect the majority No as a line of best fit can still be drawn No, it is an anomaly Not acceptable examples Yes, … Outliers can be ignored [no decision] No, the outlier can be ignored so the correlation is negative No there are other things that can affect the test
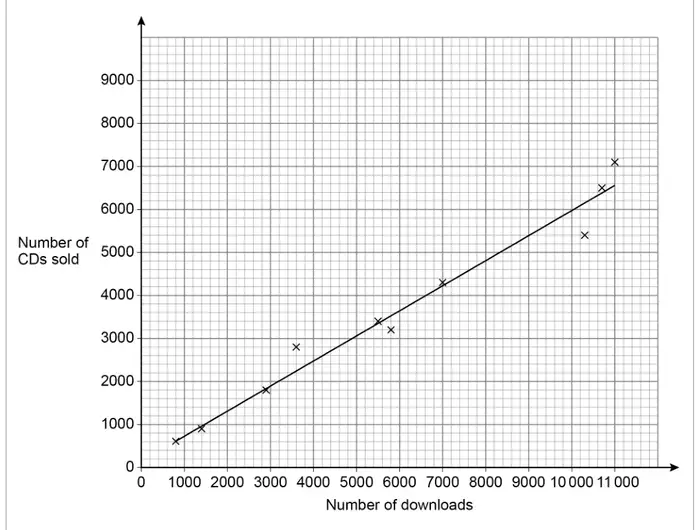
the number of downloads on the first day and the number of CDs sold on the first day.
A line of best fit has been drawn on the scatter graph.
(a) The scatter graph shows positive correlation.
Describe the relationship between number of downloads and number of CDs sold. [1 mark]
(b) The company earns
£2.50 for each download and £3 for each CD sold.
The company releases another album.
On the first day it has 9000 downloads.
Estimate the total amount the company earns from downloads and CDs of the album that day. [3 marks]
Mark scheme (a)
Answer
Mark
Comments
Valid description
B1
eg as downloads increase, so do CD sales downloads are about \(\left[1\dfrac{1}{3},\ 2\right]\) times as many as CDs CDs are about \(\left[\dfrac{1}{2},\ \dfrac{3}{4}\right]\) as many as downloads
Additional guidance
Ignore ‘Positive correlation’
Condone references to causality eg an increase in downloads causes an increase in CDs sold
B1
As one goes up the other goes up / Both go up at a similar rate