
Foundation June 2024 Paper 3 Q12
12 Liz records the distance of some runs and the time each run takes.
| Distance (km) | 3 | 4 | 5.5 | 6 | 6.5 | 7 | 8 | 8.5 |
| Time (min) | 14 | 17 | 22 | 23 | 26 | 31 | 38 | 42 |
The scatter graph shows some of the information from the table.
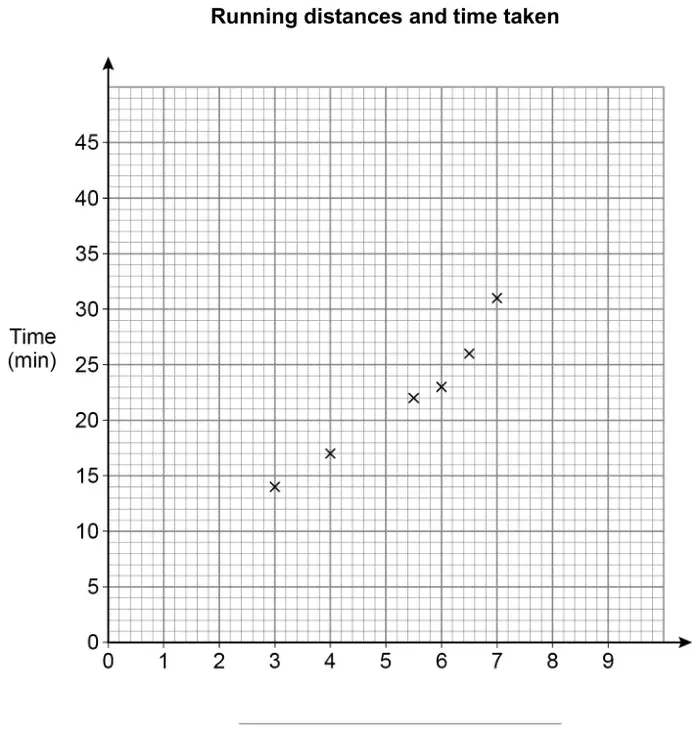
(a) Complete the graph by adding the missing label and plotting the two missing points. [2 marks]
(b) Describe the correlation shown in the scatter graph. [2 marks]
Type of correlation \(\ldots\ldots\ldots\)
Strength of correlation \(\ldots\ldots\ldots\)
| Answer | Mark | Comments |
|---|---|---|
| Distance (km) | B1 | oe must have units |
| (8, 38) and (8.5, 42) plotted | B1 | \(\dfrac{1}{2}\) square |
Additional guidance
Ignore any lines
Ignore other plots
| Answer | Mark | Comments |
|---|---|---|
| Positive | B1 | oe |
| Strong | B1 | oe eg fairly strong SC1 answers in reverse order |