
Foundation June 2025 Paper 3 Q12
12 The table shows the age and value of some cars.
| Age of car (years) | 2 | 3 | 3 | 4 | 5 | 6 | 7 | 10 |
|---|---|---|---|---|---|---|---|---|
| Value of car (nearest £1000) | 22 000 | 21 000 | 18 000 | 19 000 | 14 000 | 12 000 | 9000 | 5000 |
Anil draws this scatter diagram and line of best fit for the data.
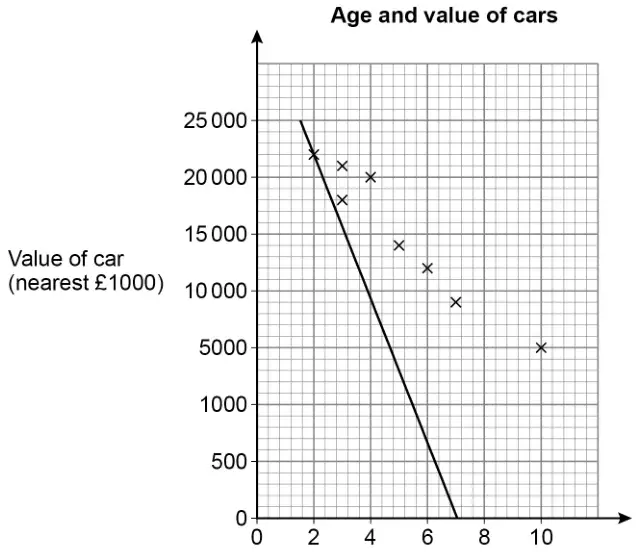
Write down two mistakes he has made. [2 marks]
| Answer | Mark | Comments |
|---|---|---|
Two mistakes from
| B2 | B1 one correct mistake |
Additional guidance
| Accept a correct line of best fit drawn on the diagram | B1 |
| Accept point correctly plotted on diagram (4, 19 000) | B1 |
| The line is wrong (condone) | B1 |
| Line does not go through the middle of the points (condone) | B1 |
| The line of best fit isn’t going through the points | B1 |
| Point at 19 000 is wrong | B1 |
| Values go up differently on the vertical scale | B1 |
| The line of best fit isn’t going through any points | B0 |
| One of the points is wrong | B0 |
| Values on the axis are wrong | B0 |