
Higher November 2019 Paper 3 Q3
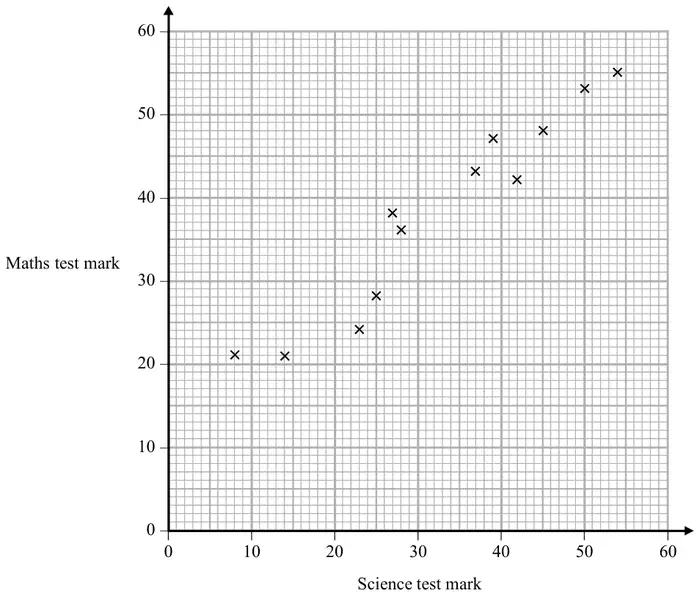
3 The scatter graph shows information about the marks a group of students got in a Science test and in a Maths test.
Jamie got a mark of 34 in the Science test.
Using the scatter graph, find an estimate for Jamie’s mark in the Maths test. (2)
| Answer | Mark | Mark scheme |
|---|---|---|
| 35 to 42 | M1 | for drawing a suitable line of best fit or for a line from \(x = 34\) or for a point marked on the grid at \((34, y)\), \(y\) in the range 33 to 44 |
| A1 | answer in the range 35 to 42 |
Additional guidance
Line at \(x = 34\) does not have to be full length of grid but should be in or reach the data set.
Acceptable values for the data set are \(y = 33\) to \(y = 44\)