
Foundation June 2019 Paper 2 Q11
11 A doctor records the ages, in years, and the heights, in centimetres, of 10 girls.
| Age (years) | 2 | 5 | 3 | 7 | 5 | 8 | 3 | 6 | 9 | 4 |
|---|---|---|---|---|---|---|---|---|---|---|
| Height (cm) | 85 | 115 | 93 | 120 | 110 | 125 | 90 | 117 | 127 | 103 |
The points for the first six girls are plotted on the scatter diagram.
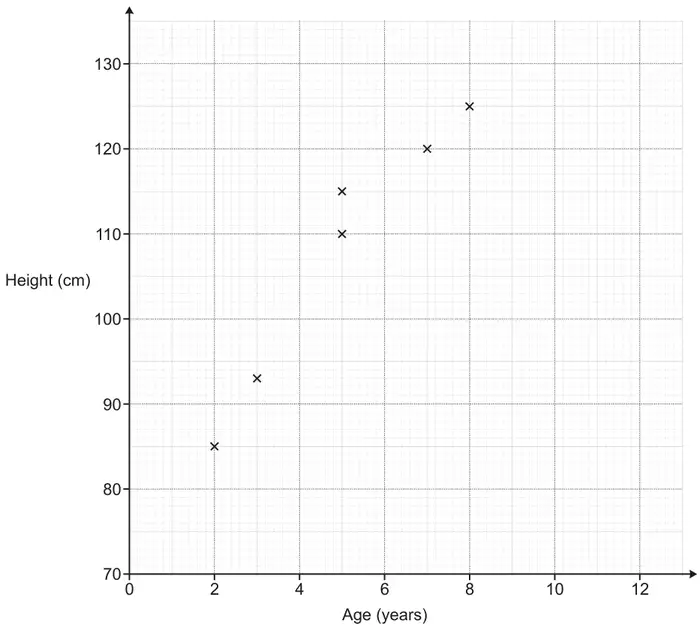
(a) Plot the points for the remaining four girls. [2]
(b) Describe the type of correlation shown in the scatter diagram. [1]
(c) The doctor says that by using a line of best fit on the scatter diagram, the height of a 6-year-old girl is around 95 cm.
Does the scatter diagram support the doctor’s statement?
Explain your reasoning. [2]
(d) Explain why the scatter diagram and line of best fit should not be used to estimate the height of a 12-year-old girl. [1]
| Answer | Marks | Part marks and guidance | |
|---|---|---|---|
| Four points correctly plotted | 2 | B1 for 2 or 3 correct plots | Overlay gives guidance, tolerance ± ½ small square |
| Answer | Marks | Part marks and guidance | |
|---|---|---|---|
| Positive | 1 | Ignore embellishments | |
| Answer | Marks | Part marks and guidance | |
|---|---|---|---|
| Ruled line of best fit | 1 | Use overlay for LOBF – ruled line should touch blue lines and should not go outside the yellow lines | |
| No - it is too low oe | 1 | Eg No, at 95cm you’re only about age 3 SEE APPENDIX | |
Appendix
Exemplar responses for the second mark of Q11c
| Response | Mark |
|---|---|
| No, the LOF shows that the girl is 105cm (LOBF passing through (6, 105) but allow accuracy within 1 square vertically of line) | 1 |
| No because the LBF is further away | 1 |
| The scatter diagram doesn’t support the doctors statement, the diagram said that is around 117 cm the height | 1 |
| No, because the six year old on this diagram is 117 in height (this is ok without referring to LOBF as they are referring to the diagram) | 1 |
| No, the height would be around 114 (114 read from their LOBF or in range 110-120) | 1 |
| No, because the plotting is mostly at the top of the line, only (age) 3 at 95 (this last part is the alternative correct reason) | 1 |
| Because 6 is 117 on the diagram (No decision is stated) | 0 |
| Yes because in the SD there is a 6 yr old girl that has a height of 117 (Statement acceptable but wrong decision of yes) | 0 |
| No the height of a 9 year old is 110 (LOBF passes through (6, 115) | 0 |
| 6 year olds are about 100 – 110 (giving a range 110 – 120 in the statement would earn the mark) | 0 (1) |
| Answer | Marks | Part marks and guidance | |
|---|---|---|---|
| Only have data on heights up to age 9 oe | 1 | e.g. the trend may not continue SEE APPENDIX | |
Appendix
Exemplar responses for Q11d
| Response | Mark |
|---|---|
| Because the graph has only been plotted from 2 – 9 years old so you would not get an accurate estimation. | 1 |
| Because the correlation of height with the age is not always the same | 1 |
| Because there has been no 12 year olds that were in the group of girls which means it may be an unfair assumption | 1 |
| Because the graph doesn't cover that age group and the growth process can change then | 1 |
| There is no data beyond a 9 year old so it would be unreliable | 1 |
| Because there are no points plotted for a 12 year old | 1 |
| You are missing 2 age groups not including 12 anyway so it wouldn’t be accurate | 1 |
| Because there is no original data on the diagram for anyone over 10 | 1 |
| After 9 years points may not be near the line of best fit (Reference to trend in the given data changing is ok) | 1 |
| A 12 year old girl would be too tall for this diagram (reference to scale/size of axes rather than available data) | 0 |
| Because the line of best fit won't go that far because the graph only goes up to 135cm | 0 |
| Because it will go out of the graph | 0 |
| Because the line of best fit would say the 12 year old girl would be about 160cm | 0 |
| Because there is no height recorded (not enough) | 0 |
| Growth slows down as they get taller (Referring to trend in growth scores 0) | 0 |
| This is because at this age girls will be different heights because of puberty | 0 |