
Higher November 2019 Paper 4 Q7
7 12 students take two tests.
Each test is out of 60.
The scatter diagram shows the results for 10 of the students.
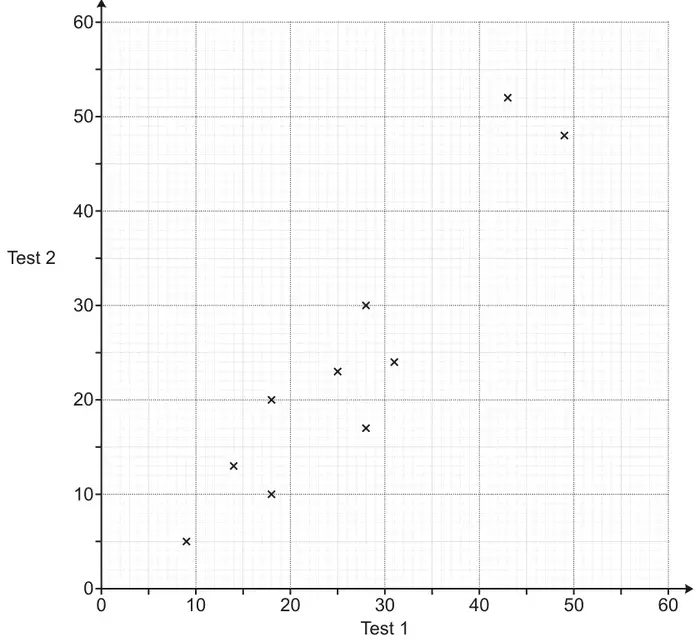
(a) The table shows the results for the other 2 students.
| Test 1 | 36 | 38 |
|---|---|---|
| Test 2 | 44 | 41 |
Plot these results on the scatter diagram. [1]
(b) Describe the type of correlation shown in the scatter diagram. [1]
(c)
(i) Draw a line of best fit on the scatter diagram. [1]
(ii) Another student was absent for Test 2.
The student scored 40 marks on Test 1.
Use your line of best fit to estimate a result for this student on Test 2. [1]
The student scored 40 marks on Test 1.
Use your line of best fit to estimate a result for this student on Test 2. [1]
(d) Work out the percentage of the 12 students whose result on Test 1 is lower than their result on Test 2. [4]
| Answer | Marks | Part marks and guidance | |
|---|---|---|---|
| 2 points plotted correctly | 1 | tolerance ± ½ small square | |
| Answer | Marks | Part marks and guidance | |
|---|---|---|---|
| positive | 1 | Ignore embellishments | |
| Answer | Marks | Part marks and guidance | |
|---|---|---|---|
| (i) acceptable ruled line | 1 | see overlay, it must be at least from \(x = 10\) to \(x = 45\) and between (10,4) to (10,12) and (45,40) to (45,50) if more than 1 line, both must be in tolerance, ignore horizontal and vertical lines. | |
| (ii) 35 to 44 | 1 | for answers out of tolerance FT their ruled line with positive gradient with tolerance ± ½ small square | |
| Answer | Marks | Part marks and guidance | |
|---|---|---|---|
| 42 or 41.7 or 41.66… or 41.67 | 4 | B1 for 5 M1 for \(\frac{\textit{their}\ 5}{12}\) M1 for (their \(\frac{5}{12}\)) × 100 If 0 scored SC2 for answer of 30 from \(\frac{3}{10}\) or 36[.36…] or 36.4 from \(\frac{4}{11}\) | their 5 must be less than 12 implied by [0].4166… |