
Foundation June 2017 Paper 1 Q21
21 The scatter graph shows the maximum temperature and the number of hours of sunshine in fourteen British towns on one day.
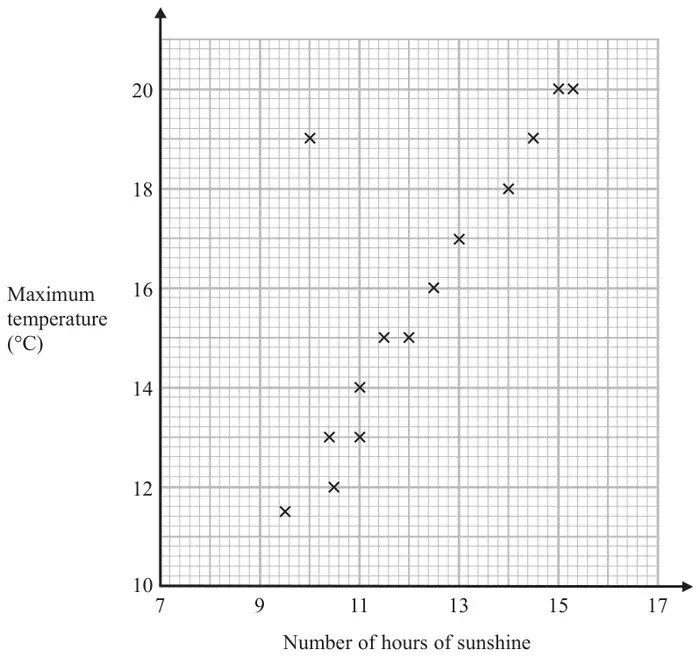
One of the points is an outlier.
(a) Write down the coordinates of this point. (1)
(b) For all the other points write down the type of correlation. (1)
On the same day, in another British town, the maximum temperature was 16.4°C.
(c) Estimate the number of hours of sunshine in this town on this day. (2)
A weatherman says,
“Temperatures are higher on days when there is more sunshine.”
(d) Does the scatter graph support what the weatherman says?
Give a reason for your answer. (1)
Give a reason for your answer. (1)
| Answer | Mark | Notes |
|---|---|---|
| (10, 19) | B1 | cao |
| Answer | Mark | Notes |
|---|---|---|
| Positive | C1 | positive (correlation) |
| Answer | Mark | Notes |
|---|---|---|
| 12 to 13 | M1 | for an appropriate line of best fit drawn, or a point marked at \((x, 16.4)\) or a horizontal line drawn from 16.4 across to \((x, 16.4)\) where \(x\) is in the range 12 to 13 |
| A1 | hours given in the range 12 to 13 |
| Answer | Mark | Notes |
|---|---|---|
| explanation | C1 | (yes) e.g. as the majority of points for high temperature appear when there are more hours of sunshine (positive correlation) |